Bull Flag Pattern: Entry, Stop and Target
The bull flag is a continuation pattern, not a reversal signal. It forms when a strong directional move—the flagpole—is followed by a bounded, slightly counter-trend consolidation—the flag—before...
Reviewed using our forex & CFD broker review methodology
Checked on: 2026-08-17 | Broker terms, regulation, and pricing can change. Always verify at the official PU Prime site before opening an account.
Affiliate Disclosure: HNL Growth may earn a commission if you open an account through our links, at no additional cost to you. Risk Warning: CFDs and leveraged forex products are complex instruments and carry a high risk of losing money rapidly due to leverage. 62.2% of retail investor accounts lose money when trading CFDs with this provider. Trading forex and CFDs may not be suitable for all investors. Consider your objectives, experience, and risk appetite before trading, and ensure you understand the risks involved. Broker Disclosure: PU Prime is a live, regulated multi-entity broker (not a simulated prop-firm evaluation) — trades are executed with real capital in live market conditions, subject to normal market risk. Which PU Prime entity holds your account depends on your country of residence and determines your leverage cap and protections.
Last verified: August 2026 | Editorial Team
Bull Flag Pattern: Entry, Stop and Target
Disclosure: This page may contain affiliate links. We may earn a commission if you open an account through our links, at no extra cost to you.
The bull flag is a continuation pattern, not a reversal signal. It forms when a strong directional move—the flagpole—is followed by a bounded, slightly counter-trend consolidation—the flag—before price resumes in the original direction. Traders use it to join an established trend after a controlled pause rather than chasing an extended move. Reliability depends on three conditions: the market must be in a trending regime, the consolidation must show volume contraction, and the breakout must be confirmed by an expansion in volume. No pattern guarantees a profitable outcome, and the bull flag is a probability-based tool, not a prediction system.
What the Bull Flag Actually Is
PU Prime — Multi-Entity Forex & CFD Broker
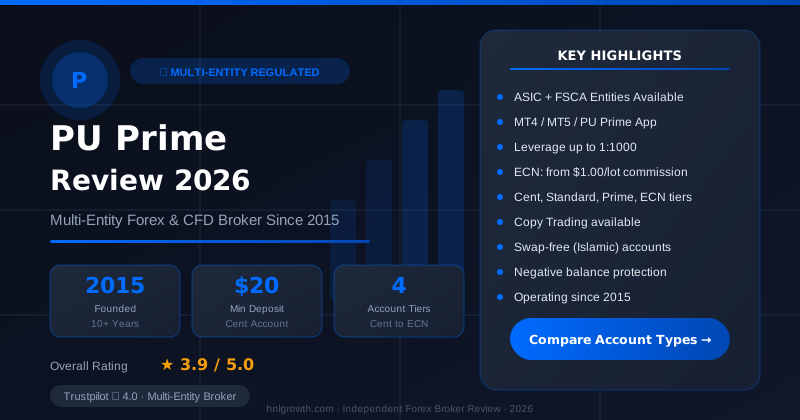
ASIC (AU) + FSCA (ZA) entities available · $20 min deposit (Cent) · MT4, MT5, PU Prime App · 4 account tiers
Picture a currency pair or stock that has surged sharply over several candles. You notice the move and wonder: do you chase it, or wait? The bull flag answers that question by giving you a defined moment to enter—after the trend has proved itself but before the next leg begins.
The name is literal. The flagpole is the sharp prior trend: a near-vertical climb on above-average volume. The flag is what follows: a brief, orderly pullback contained within two roughly parallel, slightly downward-sloping trendlines. The flag represents profit-taking by traders who rode the pole, not a genuine reversal. When that selling exhausts itself, buyers re-enter and price breaks above the upper trendline—the breakout signal.
What the bull flag is not: a reversal pattern, a predictor of direction, or a standalone signal. It works in trending markets and loses statistical edge in sideways or choppy conditions.
The Three-Part Structure
Every valid bull flag has three measurable components.
The flagpole forms on a clean, directional move with above-average volume—practitioners typically look for 2–3 times the average daily or bar volume. The move should be relatively straight, without significant retracement mid-pole. Duration varies by timeframe: on a 5-minute chart, two to five bars is common; on a daily chart, several days to two weeks.
The flag (consolidation channel) forms immediately after the pole. Key measurable thresholds:
- Retracement depth: ideally 10–25% of the flagpole height. Retracements beyond 38% begin to reduce confidence; anything above 50% is a warning signal that the move may be reversing rather than consolidating.
- Trendline structure: two roughly parallel lines, both sloping mildly downward (or occasionally sideways). If the lines converge, you are looking at a pennant, not a flag.
- Duration: typically 5–20 bars at the chart's timeframe; on daily charts, generally under three weeks. A consolidation that extends beyond 20 bars loses the momentum context that defines the pattern.
- Volume behavior: volume should contract visibly during the flag. This is the signature of controlled profit-taking, not aggressive selling. Rising volume during the consolidation suggests institutional distribution—a meaningful warning.
The breakout point is a candle close above the upper flag trendline on expanding volume. Practitioners use a 50% or greater increase above average volume on the breakout candle as a confirmation threshold. A gap-only breakout—where price jumps the trendline on the open without a preceding close above it—carries higher false-signal risk.
How to Identify One Before It Breaks Out
Use this pre-trade checklist before committing to any position.
| Criteria | Requirement | Rejection Trigger |
|---|---|---|
| Flagpole: volume | 2–3× average bar volume during pole formation | Volume below average on the move that forms the pole |
| Flagpole: structure | Clean directional move, minimal retracement mid-pole | Choppy or overlapping candles during the pole |
| Flag: retracement depth | 10–25% of flagpole height (practitioner guideline) | Retracement exceeds 50% of flagpole |
| Flag: trendlines | Two roughly parallel, mildly declining lines | Converging lines (pennant) or both lines sloping upward (wedge) |
| Flag: volume | Declining or contracting through consolidation | Volume rising or flat during consolidation |
| Flag: duration | Under 20 bars at chart timeframe; under 3 weeks on daily | Consolidation extends beyond 20 bars or 3 weeks |
| Breakout: volume | 50%+ above average on breakout candle | Breakout on below-average volume |
| Breakout: candle close | Full candle closes above upper trendline | Price touches but fails to close above upper trendline |
| Market regime | Broader trend is up; avoid choppy/sideways conditions | No clear prior uptrend; major event risk pending |
Secondary validators worth checking: price sitting above a rising 20-period moving average during the flag, or holding above VWAP on intraday charts. These are supporting filters, not primary criteria.
Entry, Stop, and Target: The Three Numbers You Need
This is the section most traders searching for "bull flag pattern" actually need. Three entry approaches exist, each with different risk profiles.
Entry Methods
| Method | Entry Trigger | Advantage | Risk | Best For |
|---|---|---|---|---|
| Breakout entry | Candle close above upper flag trendline | High confirmation; pattern is validated | Fill price often above theoretical breakout due to momentum and spread | Day traders; beginners learning the pattern |
| Pullback-retest entry | Price returns to broken trendline after breakout | Better entry price; improved risk/reward ratio | Pattern may not retest; waiting risks missing the move | Swing traders; those prioritising R:R over certainty |
| Anticipation entry | Inside the flag, near the lower trendline or consolidation support | Earliest entry; widest potential profit | Highest false-signal risk; breakout may not occur | Experienced traders in high-conviction trending conditions only |
One execution reality beginners often overlook: in live markets, breakout entries frequently fill above the theoretical trigger price. Momentum and spread mean your actual entry is higher than the trendline. This is normal—size and stop placement accordingly.
Stop-Loss Placement
Place the stop below the consolidation low, not below the entry candle. The rationale is pattern invalidation: if price falls through the flag's lowest point, the consolidation structure has failed and the setup no longer applies. Placing stops at arbitrary pip distances or below the entry candle exposes you to normal post-breakout volatility that has nothing to do with pattern failure.
Profit-Target Calculation
Two methods are widely used by practitioners:
Method 1 — Conservative (flag channel width): Measure the vertical height of the flag channel from the highest to the lowest point of the consolidation. Project that distance upward from the breakout point.
Method 2 — Optimistic (full flagpole projection): Measure the flagpole from its base to its peak. Project that distance upward from the breakout point.
Worked Example
The following uses hypothetical price levels to illustrate the calculation method. These figures are not derived from a live trade, backtested result, or measured spread—they are illustrative only.
Assume EUR/USD forms a flagpole from 1.0800 to 1.0900 (100 pips). The flag retraces to a low of 1.0870 and the upper trendline sits at approximately 1.0895 at breakout.
- Breakout entry: 1.0897 (accounting for spread and momentum; actual fill will vary)
- Stop-loss: below consolidation low at 1.0865 (32 pips risk)
- Target 1 (flag width): flag channel measured at 30 pips → target at 1.0927 → risk/reward approximately 0.9:1 (marginal; consider whether pattern quality warrants entry)
- Target 2 (flagpole projection): 100-pip pole projected from 1.0895 → target at 1.0995 → risk/reward approximately 3:1 ✓
The minimum risk/reward practitioners typically require before entry is 2:1. If either target method does not reach 2:1 given your stop placement, the setup's geometry does not justify the trade at that entry price. Consider a pullback-retest entry to improve the ratio.
When the Pattern Fails—and What to Do
A stopped-out trade does not mean the pattern failed. It means you had a valid setup in a probabilistic system, and this instance went against you. What matters is distinguishing a correctly executed stop-out from a misidentified pattern.
Three failure modes account for most bull flag losses:
Failure Mode 1: False breakout with immediate reversal. Price closes above the upper trendline on volume, then reverses sharply within one to three candles.
Response action: If price re-enters the flag channel and closes below the midpoint, exit. Do not wait for the stop-loss if the candle-by-candle behaviour contradicts the setup. Your stop below the consolidation low remains your maximum loss; early exit may preserve more capital when the signal is clearly invalid. These are practitioner heuristics, not rules with proven statistical outcomes.
Failure Mode 2: Retracement exceeds 50% of the flagpole. While still inside the flag, price falls deeper than half the pole's height.
Response action: Reduce conviction and do not add to a planned position. If already entered (anticipation entry), consider exiting early. The pattern's continuation thesis weakens significantly above 50% retracement. Wait for the setup to rebuild rather than defending a deteriorating position.
Failure Mode 3: Consolidation extends beyond 20 bars or three weeks. The flag refuses to break in either direction.
Response action: Remove the setup from your watchlist. Extended consolidation dissipates the momentum that defines the bull flag. The pattern's statistical context no longer applies. Re-evaluate from scratch if a new flagpole forms.
Note: the response actions described above are practitioner-derived guidelines. There is no empirical evidence presented here that these specific thresholds reduce losses or improve outcomes relative to alternatives. Apply them as starting frameworks and adjust based on your own tracked results.
Warning signs to watch before breakout: consolidation volume failing to contract, price repeatedly testing the lower trendline rather than the upper, and broad market conditions shifting (major macro event, index reversal). Any one of these does not automatically invalidate the setup, but two or more together warrant standing aside.
Bull Flag vs. Bear Flag: Same Shape, Different Context
The bear flag is the mirror image: a sharp decline (the pole) followed by a bounded upward-sloping consolidation, before price resumes lower. Understanding both clarifies what the bull flag is not.
| Feature | Bull Flag | Bear Flag |
|---|---|---|
| Prior trend direction | Upward | Downward |
| Flagpole direction | Sharp rally | Sharp decline |
| Consolidation slope | Mildly downward (counter-trend) | Mildly upward (counter-trend) |
| Volume during flag | Contracting | Contracting (same behaviour) |
| Volume on breakout | Expanding upward | Expanding downward |
| Dominant psychology | Controlled profit-taking by longs | Fear-driven short covering; weak-hand longs exiting |
| Performance context | Stronger in established uptrends | Stronger in established downtrends |
| Typical retracement depth | 10–25% of pole (practitioner guideline) | 10–25% of pole (tends to be similar) |
Published pattern research—including figures associated with Thomas Bulkowski's historical equity studies—describes both flags as continuation setups that perform better in their respective trending regimes. These figures are dataset-specific, derived from historical equity data under particular market conditions, and should not be interpreted as a performance guarantee in live trading. Treat both patterns as probability-based continuation setups, not certainties.
Not a Flag: Patterns Traders Confuse It With
| Pattern | Key Visual Difference | Trendline Structure | False-Signal Risk vs. Bull Flag |
|---|---|---|---|
| Pennant | Triangular consolidation, not a channel | Converging (upper descends, lower ascends) | Similar; converging lines are the tell |
| Rising wedge | Both trendlines slope upward | Both trendlines rise; often a reversal pattern | Higher false-signal risk on breakout; frequently resolves downward |
| Flat-top breakout | No lower trendline; horizontal resistance only | Single resistance line, no parallel support | Different geometry; valid pattern but not a flag |
| Ascending triangle | Flat upper resistance, rising lower trendline | One horizontal, one rising | Volume and breakout logic similar; triangles have longer formation time |
| Reversal flag | Appears after a downtrend, not an uptrend | Parallel declining trendlines (same shape) | Shape identical—context (prior trend) is the only differentiator |
The single most common confusion is bull flag versus pennant. The trendlines are the separator: parallel means flag, converging means pennant. Both are continuation patterns, but the entry geometry and target calculation methods differ.
Timeframe and Market Conditions
The bull flag appears across all timeframes. What changes is the duration of each component and the execution requirements.
| Trader Type | Preferred Timeframe | Typical Flag Duration | Volume Indicator Priority | Key Consideration |
|---|---|---|---|---|
| Day trader | 1-minute, 5-minute | 5–20 bars intraday (minutes to ~1 hour) | Real-time volume essential | Slippage on breakout entries is proportionally larger; tight-spread instrument matters |
| Swing trader | Daily chart | 1–3 weeks | Volume moving average benchmark | Overnight holding rules and swap costs apply; check your broker's specific rates for the instrument you are trading |
| Scalper | Sub-minute (30-second, 1-minute) | 3–10 bars | Tick volume as proxy | Spread cost is a major factor in R:R calculation; sub-pip execution matters |
Asset-class calibration: there is a practitioner-held view that forex flags tend to form with tighter retracement ranges and shorter duration than equity flags, partly attributed to the 24-hour market structure distributing profit-taking pressure across sessions. Commodity and precious metal flags may exhibit wider retracement before resumption, particularly around macro data releases. These are observational generalisations, not findings from a controlled study. Apply stock-derived thresholds to forex or commodities as a starting point only, and observe how the specific instrument behaves before treating any threshold as fixed.
One regime filter worth applying regardless of timeframe: avoid bull flag setups when the broader asset class or index is in a confirmed downtrend or sideways chop. Published research on bull flag reliability—including figures often cited from Bulkowski's pattern studies suggesting approximately 64% continuation rates in bull markets—reflects trending market conditions. That figure is dataset-dependent, conditional on pattern quality and volume confirmation, and is not a replicable guarantee. In choppy or bearish conditions, continuation rates fall materially.
Practising the Pattern Before Risking Real Capital
Understanding the mechanics and executing under live price movement are different skills. The gap between them is where most early flag trades fail—not because the pattern is wrong, but because the trader misidentifies the pattern, enters too early, or misplaces the stop.
A demo account is one way to bridge that gap by practising pattern identification, entry timing, and stop placement under real market prices without risking capital. It is a practice tool, not a substitute for live-market experience, and progression to a live account remains an entirely separate decision that depends on your own readiness and risk tolerance.
What to track across your practice trades:
- How often your identified patterns met all checklist criteria before you entered
- The difference between your theoretical entry price and your actual fill
- How many stopped-out trades reflected misidentified patterns versus correctly identified patterns that simply failed
- Your average R:R achieved versus your planned R:R
Before opening any account, verify the following directly with the broker:
- Which regulatory entity and jurisdiction will apply to your account
- The leverage limits, margin requirements, and negative balance protection (if any) for that entity
- Spreads and commission structures for the instruments you intend to trade (PU Prime publishes indicative spread tables at puprime.com/spread-and-costs, though values change with market conditions)
- Withdrawal methods, processing times, and any associated fees
- The terms and conditions for any promotional offers before accepting them
PU Prime offers Standard, Prime, and ECN account types across MT4 and MT5. Demo access is available while live account verification is in progress. According to the official account information page, account opening takes approximately 10–15 minutes, and minimum deposits for live accounts start at $20 for the Cent account and $50 for the Standard account.
Frequently Asked Questions
How reliable is the bull flag pattern? Reliability is conditional, not fixed. Research figures often cited from pattern studies (approximately 64% continuation in bull markets) are dataset-specific and depend heavily on pattern quality, volume confirmation, and market regime. In choppy or bearish conditions, continuation rates are lower. Treat the pattern as a probability-based tool with defined risk management, not a high-win-rate formula.
When does the bull flag fail most often? The three most common failure modes are: a false breakout that immediately reverses, a retracement that exceeds 50% of the flagpole before breakout, and an extended consolidation beyond 20 bars that dissipates the setup's momentum context. Volume that fails to contract during the flag is the earliest warning sign.
How is a bull flag different from a pennant? The trendlines. A bull flag has two roughly parallel, mildly declining trendlines forming a channel. A pennant has converging trendlines forming a triangle. Both are continuation patterns with similar entry logic, but the geometry—and therefore the target calculation—differs.
Which timeframe works best for the bull flag? There is no single best timeframe. Day traders typically work on 1-minute and 5-minute charts; swing traders use the daily chart; scalpers use sub-minute charts. Each timeframe produces different typical flag durations and different execution demands. Choose the timeframe that matches your available screen time and account type.
How do I calculate the profit target? Two methods: (1) measure the vertical height of the flag channel and project it upward from the breakout point—the conservative target; (2) measure the full flagpole height and project it upward from the breakout point—the optimistic target. Always check that at least one target produces a minimum 2:1 risk/reward ratio relative to your stop-loss before entering.
Can I trade the bull flag on forex? Yes. Forex flags are generally considered to form with tighter retracement and shorter duration than equity flags, partly due to the 24-hour market structure—though this is a practitioner generalisation rather than a finding from controlled research. The same checklist applies, but thresholds derived from equity research should be calibrated to the specific currency pair's behaviour rather than applied unchanged.
Risk Warning
Risk warning: CFDs and leveraged forex products are complex instruments and carry a high risk of losing money rapidly due to leverage. Consider whether you understand how these products work and whether you can afford to take the high risk of losing your capital. Check the entity, terms and protections that apply in your jurisdiction before trading.
PU Prime operates under the oversight of multiple financial regulators, including the Financial Services Authority of Seychelles (FSA), the Financial Services Commission of Mauritius (FSC), the Financial Sector Conduct Authority of South Africa (FSCA), and the Capital Market Authority of the UAE (CMA), as stated on the broker's regulation page. Regulatory protections, leverage limits, and client fund arrangements vary by entity and jurisdiction. Verify the specific terms that apply to your account before depositing. Full regulatory details are available at puprime.com/regulation — check that page directly, as regulatory status can change.
Technical pattern analysis does not guarantee any specific trading outcome. Past pattern performance in published research is dataset-specific and historical. No pattern, including the bull flag, predicts future price movement with certainty.
Ready to Compare PU Prime Account Types?
PU Prime is a multi-entity broker — ASIC (Australia) and FSCA (South Africa) regulated entities offer stronger oversight, while most international clients are onboarded to the FSA Seychelles or FSC Mauritius entities. Four account tiers (Cent, Standard, Prime, ECN) range from a $20 minimum deposit to full ECN pricing.
Risk disclaimer: PU Prime is a live, regulated multi-entity broker — trading forex and CFDs is done with real capital under normal market risk (this is not a simulated prop-firm evaluation). PU Prime operates under multiple separate licenses (ASIC, FSCA, FSA Seychelles, FSC Mauritius); which entity holds your account depends on your country of residence and determines your leverage cap and protections — confirm this before funding. CFDs and leveraged forex products are complex instruments and carry a high risk of losing money rapidly due to leverage; 62.2% of retail investor accounts lose money when trading CFDs with this provider. Consider whether you understand how CFDs/forex work and whether you can afford the high risk of losing your money. Affiliate disclosure: HNL Growth earns a commission when you open a PU Prime account through links on this page.