Bullish Candlestick Patterns Every Trader Should Know
A bullish candlestick pattern is a price formation—sometimes a single candle, sometimes two or three—that signals buyers may be taking control from sellers, pointing to a potential upward reversal or...
Reviewed using our forex & CFD broker review methodology
Checked on: 2026-08-17 | Broker terms, regulation, and pricing can change. Always verify at the official PU Prime site before opening an account.
Affiliate Disclosure: HNL Growth may earn a commission if you open an account through our links, at no additional cost to you. Risk Warning: CFDs and leveraged forex products are complex instruments and carry a high risk of losing money rapidly due to leverage. 62.2% of retail investor accounts lose money when trading CFDs with this provider. Trading forex and CFDs may not be suitable for all investors. Consider your objectives, experience, and risk appetite before trading, and ensure you understand the risks involved. Broker Disclosure: PU Prime is a live, regulated multi-entity broker (not a simulated prop-firm evaluation) — trades are executed with real capital in live market conditions, subject to normal market risk. Which PU Prime entity holds your account depends on your country of residence and determines your leverage cap and protections.
Last verified: August 2026 | Editorial Team
Bullish Candlestick Patterns Every Trader Should Know
A bullish candlestick pattern is a price formation—sometimes a single candle, sometimes two or three—that signals buyers may be taking control from sellers, pointing to a potential upward reversal or continuation. The shape alone does not predict the future. Reliability depends on where the pattern appears relative to the prior trend and nearby support levels, whether volume confirms it, and whether the candle that follows validates the initial signal. This guide teaches beginners to identify four high-value patterns correctly, understand when they carry weight, and treat them as probability tools rather than guarantees.
Disclosure: This page may contain affiliate links. We may earn a commission if you open an account through our links, at no extra cost to you.
What a Bullish Candlestick Pattern Is, in Plain Terms
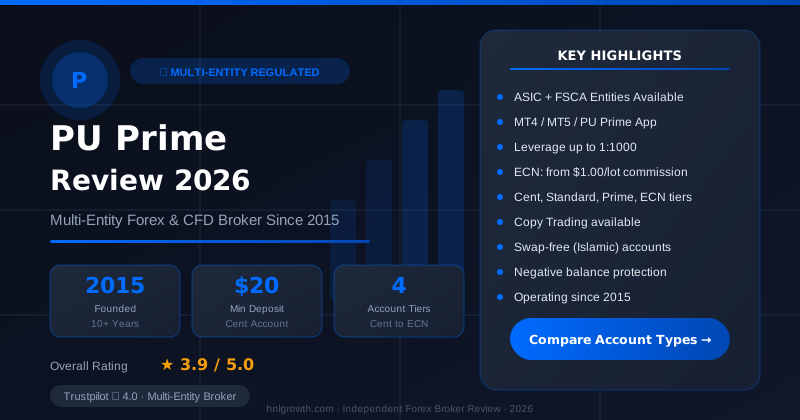
PU Prime — Multi-Entity Forex & CFD Broker
ASIC (AU) + FSCA (ZA) entities available · $20 min deposit (Cent) · MT4, MT5, PU Prime App · 4 account tiers
Before price forms a pattern, it forms individual candles. Each candlestick represents a fixed period—five minutes, one hour, one day—and shows four prices: the opening price, the closing price, the highest price reached (the high), and the lowest price touched (the low).
The rectangular block in the middle is the body. When the close is higher than the open, the body is typically colored green or white. When the close is lower, the body is red or black. The thin lines extending above and below the body are wicks (or shadows). The upper wick shows how far price climbed before pulling back; the lower wick shows how far it fell before recovering.
A bullish candlestick pattern forms when one or more candles suggest that buyers stepped in forcefully enough to reverse or sustain an upward move. The key signal is not the color alone but the relationship between the open, close, and wicks, combined with the pattern's location within the broader trend.
Four patterns offer the clearest risk-reward and the least ambiguity for beginners:
- Hammer – A small body near the top of the candle with a long lower wick, typically appearing after a downtrend. It shows sellers pushed price lower but buyers regained control before the close.
- Bullish Engulfing – A two-candle pattern where a small red candle is followed by a larger green candle whose body completely engulfs the prior candle's body. It signals a shift in momentum.
- Morning Star – A three-candle reversal pattern: a long red candle, a small-bodied candle (often a doji or spinning top), then a long green candle. It shows indecision giving way to buyer conviction.
- Three White Soldiers – Three consecutive green candles with progressively higher closes and small or no upper wicks, signaling sustained buying pressure and trend continuation.
Each pattern becomes actionable only when it appears near a logical support level, follows a defined prior trend, and receives confirmation from the candle immediately after.
PU Prime offers demo accounts that mirror live market conditions with virtual capital, allowing you to practice pattern recognition without financial risk. The demo uses real prices, real spreads, and real execution, so the patterns you see are identical to those on a live account.
How It Works, with a Worked Example
The following example uses illustrative price levels to demonstrate the mechanics of pattern-based trade planning. These are not historical data or backtested results.
Assume a currency pair has been falling for three days. Price reaches 1.0850, a level that previously acted as support two weeks earlier. On day four, a hammer forms: the open is 1.0860, the low touches 1.0820, and the close is 1.0855. The body is small and near the top; the lower wick is three times the height of the body.
This hammer suggests buyers absorbed the selling pressure and pushed price back up before the session closed. But the pattern alone is not a trade signal. Confirmation comes from the next candle. If the following candle closes above 1.0860 (the hammer's open), the reversal hypothesis gains weight. If the next candle closes below 1.0840, the hammer fails.
Assume confirmation occurs: the next candle closes at 1.0875. A trader might enter long at 1.0880 (just above the confirmation candle's close). The stop-loss sits below the hammer's low at 1.0815, creating a risk of 65 pips. A 1:2 risk-reward target would place the take-profit at 1.1010 (130 pips above entry).
Volume adds conviction. If the hammer and confirmation candle both form on volume above the 20-bar average, the pattern carries more weight. Volume data is available on most platforms; compare the current bar's volume to the average of the prior 20 bars. If volume is at or below that average, treat the pattern with caution.
Here is the risk-reward breakdown for this illustrative example:
| Parameter | Price Level | Distance from Entry |
|---|---|---|
| Entry | 1.0880 | – |
| Stop-loss | 1.0815 | 65 pips (risk) |
| 1:1 target | 1.0945 | 65 pips |
| 1:2 target | 1.1010 | 130 pips |
| 1:3 target | 1.1075 | 195 pips |
Table note: These are example prices used for illustration purposes only, not historical or backtested data.
This structure ensures the trader risks one unit to gain two or three. The stop-loss is not arbitrary; it sits below the pattern's low because a move below that level invalidates the bullish thesis.
The same logic applies to the other three patterns. A Bullish Engulfing near support, confirmed by a third green candle, justifies a long entry with a stop below the engulfing candle's low. A Morning Star at a prior swing low, validated by volume and a higher close the next day, follows the same entry and stop-placement rules.
Pattern Identification Checklist
Use this table to identify the four prioritized patterns on a live chart. Each row provides objective criteria only—no subjective interpretation required.
| Pattern Name | What It Looks Like (Objective Criteria) | What It May Signal | Confirmation Needed? |
|---|---|---|---|
| Hammer | Small body near the top of the candle; lower wick at least twice the height of the body; little or no upper wick; appears after a downtrend of at least five consecutive lower closes | Potential upward reversal | Yes |
| Bullish Engulfing | Two candles: first is red (down), second is green (up) and its body completely covers the first candle's body; appears after a downtrend of at least five consecutive lower closes | Shift from selling to buying | Yes |
| Morning Star | Three candles: long red, small-bodied middle candle (any color), long green; middle candle shows indecision; appears after a downtrend of at least five consecutive lower closes | Indecision turning to buyers | Yes |
| Three White Soldiers | Three consecutive green candles; each closes higher than the prior; small or no upper wicks; progressively rising lows; appears during an established uptrend | Sustained buying pressure | Optional (already strong) |
Confirmation means the candle immediately following the pattern closes higher than the pattern's high. Until that happens, the pattern is a hypothesis, not a signal.
Confidence Self-Check
Before acting on any pattern, all four of these conditions must be present:
- Trend context present? The pattern should appear after a defined prior trend: a downtrend of at least five consecutive lower closes for reversal patterns, or an uptrend of at least five consecutive higher closes for continuation patterns. A pattern forming in the middle of a sideways range carries less weight.
- Near support or resistance? Patterns gain reliability when they form near levels where price previously reversed or stalled. Identify these levels by marking prior swing highs and lows on your chart.
- Confirmation candle closed? Wait for the next candle to close above the pattern's high before entering. Do not enter on the pattern candle itself.
- Volume above the 20-bar average? Compare the pattern candle's volume to the average volume of the prior 20 bars. The pattern candle's volume should exceed that average. If it does not, either skip the trade or reduce position size.
If any of these conditions is absent, the pattern does not meet the reliability threshold for entry.
The Main Risks and Who It Is Not For
Bullish candlestick patterns fail regularly. A hammer can form, receive a confirming candle, and still see price reverse downward the next day. This happens when the broader trend is stronger than the local signal, when no nearby support exists to anchor the reversal, or when volume is weak.
False signals are common in low-volume environments and during news events. A pattern that forms five minutes before a central bank announcement carries minimal predictive value because the news will override the technical signal.
Patterns are probability tools, not certainties. No win-rate or reliability data is provided in this article because such statistics depend on the specific market, timeframe, confirmation rules, and risk-management approach used. A trader must develop their own performance data through forward testing and journaling.
This approach is not suitable for traders who:
- Are unwilling to place stop-loss orders. Without a stop, a single failed pattern can erase multiple successful trades.
- Expect patterns to work in isolation. A hammer in the middle of a strong downtrend with no nearby support is not actionable, no matter how perfect the candle looks.
- Cannot tolerate a high failure rate. Even high-probability setups lose frequently; the edge comes from risk-reward, not win rate.
- Trade leveraged CFDs without understanding how leverage amplifies both gains and losses. A 10-pip stop on a standard lot at 1:100 leverage controls $100,000 of notional exposure; a small adverse move can close the position before the pattern has time to develop.
Regulatory context matters. PU Prime is regulated by the Financial Services Authority of Seychelles (FSA), the Financial Services Commission of Mauritius (FSC), the Financial Sector Conduct Authority of South Africa (FSCA), and the Capital Market Authority of the UAE (CMA). The entity and protections that apply depend on your jurisdiction. If you are based in the UK, EU, or US, confirm which PU Prime entity can serve you and what investor protections (if any) apply before opening an account. Regulatory protections vary significantly by region; some jurisdictions offer compensation schemes or segregated-account guarantees, while others do not.
Common Mistakes
Trading every pattern. Not every hammer or engulfing candle deserves a trade. The pattern must appear in the right context (after a trend of at least five candles, near support or resistance) and receive confirmation. Beginners often see the shape and enter immediately, ignoring location and confirmation.
Ignoring the prior trend. A hammer is a reversal pattern. It only makes sense after a downtrend. A hammer appearing after an uptrend or in a sideways range is not a reliable signal.
Skipping confirmation. The pattern candle is a hypothesis. The confirmation candle is the evidence. Entering before the confirmation candle closes increases the failure rate.
No stop-loss. Every pattern-based trade needs a predefined stop. The stop sits below the pattern's low for bullish setups. Without it, a losing trade can turn into a margin call.
Treating patterns as a complete strategy. Patterns identify potential entry points. They do not tell you where to exit, how much to risk, or when to stay flat. A full strategy includes trend filters, support/resistance mapping, position sizing, and risk management.
Ignoring volume. A pattern forming on volume at or below the 20-bar average is less reliable. Volume shows conviction. A hammer with volume exceeding the 20-bar average suggests real buying interest; a hammer on light volume may just be noise.
How to Practise It on a Demo
Pattern recognition is a skill. It improves with repetition, not with reading. The safest way to build that skill is on a demo account, where mistakes cost nothing.
Start by opening a demo account. PU Prime offers demo accounts that mirror live market conditions with virtual capital. The demo uses real prices, real spreads, and real execution, so the patterns you see are identical to those on a live account.
Once the demo is open, follow these steps:
- Load a daily chart of a major currency pair. EUR/USD, GBP/USD, and USD/JPY are liquid, well-behaved, and easy to read. Avoid exotic pairs and low-volume instruments while learning.
- Scroll back six months. Identify past downtrends (at least five consecutive lower closes) and mark them. Look for hammers, engulfing patterns, and morning stars near support levels.
- Check whether confirmation occurred. Did the next candle close above the pattern's high? If yes, mark it. If no, note it as a failed pattern.
- Measure the outcome. Place a hypothetical entry at the confirmation close, a stop below the pattern low, and a 1:2 target. Did the trade hit the target or the stop? Record the result.
- Repeat for 20 patterns. This gives you a realistic sense of how often patterns work and how they fail.
After the historical review, switch to forward testing. Identify patterns as they form in real time. Wait for confirmation. Enter the demo trade with a proper stop and target. Track each trade in a spreadsheet: date, pair, pattern type, entry, stop, target, outcome.
Forward testing reveals how emotions interfere. It is easy to spot a perfect hammer in hindsight. It is harder to wait for confirmation when price is moving. The demo lets you practice that discipline without financial consequence.
PU Prime's demo account supports MetaTrader 4 and MetaTrader 5, both of which include built-in drawing tools for marking support, resistance, and pattern structures. The mobile app also provides full charting functionality, so you can practice on any device without financial risk.
Frequently Asked Questions
What makes a bullish candlestick pattern more reliable?
Three factors: location relative to the prior trend and support levels, confirmation from the next candle, and volume exceeding the 20-bar average. A hammer forming after a downtrend, near a prior support level, with a confirming green candle and strong volume carries more weight than a hammer in isolation.
Can I trade patterns on any timeframe?
Yes, but signal clarity varies by timeframe. Patterns on one-minute and five-minute charts generate more signals but also more noise and false breakouts. Daily and four-hour charts produce fewer patterns but tend to exhibit cleaner price action. Beginners should start with daily charts and move to lower timeframes only after building consistency.
Do I need other indicators alongside patterns?
Not necessarily, but many traders combine patterns with moving averages, RSI, or MACD to filter trades. A hammer forming above a rising 50-period moving average is a stronger signal than one forming below it. The pattern provides the trigger; the indicator provides the context.
How do I know if a pattern has failed?
A pattern fails when price closes below the pattern's low after you enter. That is why the stop-loss sits there. If a hammer's low is 1.0820 and price closes at 1.0815, the reversal thesis is invalidated. Exit the trade and wait for the next setup.
Are bullish patterns more reliable than bearish patterns?
No. Both have similar failure rates. The perception that bullish patterns work better comes from the fact that markets tend to rise more slowly and fall more quickly, so downtrends are shorter and sharper. This gives bullish reversal patterns more visible opportunities, but it does not make them inherently more reliable.
Can I use patterns on stocks, commodities, and indices, or just forex?
Patterns work on any liquid market. The principles are identical whether you are trading EUR/USD, gold, the S&P 500, or individual shares. What matters is liquidity and clean price action. Avoid thinly traded instruments where a single order can distort the candle.
How long does it take to become proficient at pattern recognition?
Expect three to six months of consistent practice—reviewing historical charts, forward testing on a demo, and journaling each trade. Proficiency means you can identify patterns in real time, wait for confirmation without second-guessing, and manage losing trades without emotional reactions.
Final Thoughts
Bullish candlestick patterns are not magic. They are visual representations of buying and selling pressure, translated into shapes that recur often enough to be useful. A hammer shows buyers defended a level. An engulfing pattern shows a shift in control. A morning star shows indecision resolved in favor of buyers.
The value lies not in the pattern itself but in the context surrounding it: the prior trend, the nearby support or resistance, the volume, and the confirmation candle. Strip away that context and the pattern is just a shape with no predictive power.
Use the four prioritized patterns—Hammer, Bullish Engulfing, Morning Star, Three White Soldiers—until they become automatic. Practice on a demo until you can identify them in real time and wait for confirmation without hesitation. Track your results in a spreadsheet so you can see which setups work for you and which do not.
Patterns are one tool among many. They do not replace trend analysis, risk management, or position sizing. They complement those disciplines by providing specific entry points with defined risk. When used correctly, they improve your edge. When used carelessly, they generate losses.
Risk warning: CFDs and leveraged forex products are complex instruments and carry a high risk of losing money rapidly due to leverage. Consider whether you understand how these products work and whether you can afford to take the high risk of losing your capital. Check the entity, terms and protections that apply in your jurisdiction before trading.
Ready to Compare PU Prime Account Types?
PU Prime is a multi-entity broker — ASIC (Australia) and FSCA (South Africa) regulated entities offer stronger oversight, while most international clients are onboarded to the FSA Seychelles or FSC Mauritius entities. Four account tiers (Cent, Standard, Prime, ECN) range from a $20 minimum deposit to full ECN pricing.
Risk disclaimer: PU Prime is a live, regulated multi-entity broker — trading forex and CFDs is done with real capital under normal market risk (this is not a simulated prop-firm evaluation). PU Prime operates under multiple separate licenses (ASIC, FSCA, FSA Seychelles, FSC Mauritius); which entity holds your account depends on your country of residence and determines your leverage cap and protections — confirm this before funding. CFDs and leveraged forex products are complex instruments and carry a high risk of losing money rapidly due to leverage; 62.2% of retail investor accounts lose money when trading CFDs with this provider. Consider whether you understand how CFDs/forex work and whether you can afford the high risk of losing your money. Affiliate disclosure: HNL Growth earns a commission when you open a PU Prime account through links on this page.