Candlestick Patterns Every Trader Should Know
Candlestick patterns are visual formations on price charts that reveal shifts in buyer-seller balance. For forex traders, a focused set of high-conviction patterns — Engulfing,...
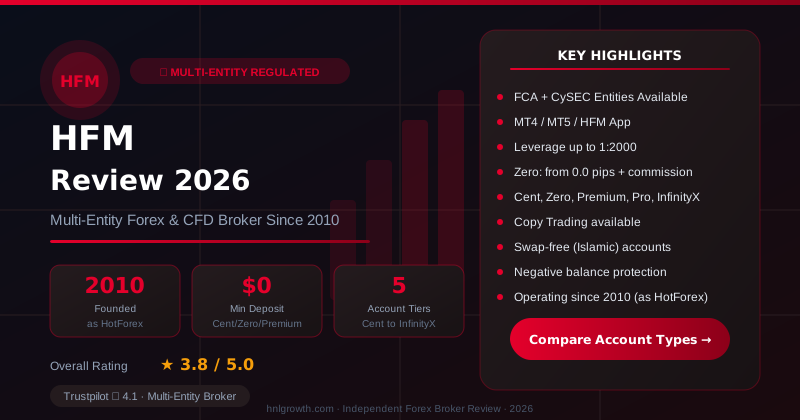
Checked on: 2026-08-06 | Broker terms, regulation, and pricing can change. Always verify at the official HFM site before opening an account.
Affiliate Disclosure: HNL Growth may earn a commission if you open an account through our links, at no additional cost to you. Risk Warning: CFDs and leveraged forex products are complex instruments and carry a high risk of losing money rapidly due to leverage. Between 65-95% of retail investor accounts lose money when trading CFDs, depending on the HFM entity and account type. Trading forex and CFDs may not be suitable for all investors. Consider your objectives, experience, and risk appetite before trading, and ensure you understand the risks involved. Broker Disclosure: HFM (HF Markets Group) is a live, regulated multi-entity broker (not a simulated prop-firm evaluation) — trades are executed with real capital in live market conditions, subject to normal market risk. Protections vary significantly by the specific legal entity that onboards your account.
Candlestick Patterns Every Trader Should Know
Candlestick patterns are visual formations on price charts that reveal shifts in buyer-seller balance. For forex traders, a focused set of high-conviction patterns — Engulfing, Hammer, Morning Star, and a handful of others — provides structured entry and exit signals when combined with trend context, key price levels, and confirmation from momentum indicators. This guide covers the patterns most relevant to currency markets, organized by signal strength, with forex-specific adjustments for 24-hour trading, session timing, and spread sensitivity. The goal is not encyclopedic coverage but a practical reference you can integrate into a disciplined trade plan — and use to assess whether your broker's platform tools and pricing conditions support pattern-based trading.
What Candlestick Patterns Actually Tell You
HashHedge — Crypto Futures Prop Firm
Up to $200K funded accounts · 85% profit split · Instant USDT payouts · 160+ assets
Every candlestick records a battle between buyers and sellers over a fixed time period. The resulting shape — body, wicks, and colour — captures who won, how decisively, and where resistance emerged. String several candles together and patterns begin to form, signalling potential reversals, continuations, or periods of indecision.
The method traces back to 18th-century Japanese rice markets and was introduced to Western traders by Steve Nison in the early 1990s. But historical pedigree is not the point. What matters is whether candlestick formations help you structure trades with defined risk in modern forex markets — where 24-hour sessions, variable liquidity, and tight spreads reshape how classical patterns behave.
Reading a Single Candle: The Four Price Points That Matter
Every candlestick encodes four values: Open, High, Low, and Close (OHLC). The relationship between these four prices determines the candle's shape and signal.
Body — the range between open and close. A large body signals strong directional conviction. A small body signals indecision or exhaustion.
Upper wick (shadow) — the line from the body's top to the high. A long upper wick shows buyers pushed price higher but sellers forced it back, signalling rejection of higher prices.
Lower wick — the line from the body's bottom to the low. A long lower wick shows sellers pushed price down but buyers reclaimed ground, signalling rejection of lower prices.
Colour — a bullish candle (typically green or white) closes above its open. A bearish candle (red or black) closes below its open. On platforms like MetaTrader 5, colour schemes are fully customizable to suit your chart template.
A single candle's meaning depends on proportion. A small body with long wicks describes a very different market state from a large body with minimal wicks, even if both cover the same total range.
Why Context Decides Whether a Signal Is Tradeable
A Hammer forming at a well-established support level after a sustained downtrend carries weight. The same Hammer appearing in a choppy, range-bound market is noise. Pattern location — at support or resistance, within a trending or consolidating market — determines whether a signal deserves attention or should be ignored entirely.
The Patterns That Earn Their Place in a Trading Plan
Rather than cataloguing dozens of formations, this section focuses on the patterns that consistently provide actionable signals in forex markets. Each entry includes signal direction, what to look for, and what typically causes the pattern to fail.
Reversal Signals: Spotting Trend Exhaustion
Hammer (1 candle, bullish) Small body at the top of the range with a lower wick at least twice the body length. Appears after a decline. Signals potential upward reversal. Confirmation: next candle must close above the Hammer's body. Failure mode: price continues lower, breaking below the wick extreme.
Shooting Star (1 candle, bearish) Mirror of the Hammer — small body near the bottom, long upper wick. Appears after an advance. Signals potential downward reversal. Confirmation: next candle closes below the Shooting Star's body. Failure mode: strong momentum absorbs the rejection and pushes through.
Bullish Engulfing (2 candles, bullish) A bearish candle followed by a larger bullish candle whose body completely covers the prior body. Signals strong buying pressure overwhelming sellers. One of the highest-conviction single-formation reversal signals in forex. Failure mode: appears in a choppy range rather than at the end of a genuine downtrend.
Bearish Engulfing (2 candles, bearish) A bullish candle followed by a larger bearish candle that engulfs the prior body. Signals sellers overwhelming buyers. Failure mode: occurs mid-range without a preceding advance to reverse.
Morning Star (3 candles, bullish) A long bearish candle, followed by a small-bodied candle (gap or no gap), followed by a long bullish candle closing at least halfway into the first candle's body. The three-candle structure provides built-in confirmation, making this one of the most reliable reversal signals. Failure mode: third candle fails to close above the midpoint of the first.
Evening Star (3 candles, bearish) Mirror of the Morning Star. Long bullish candle, small-bodied candle, long bearish candle closing at least halfway into the first body. Failure mode: the small middle candle is simply a brief pause before continuation higher.
Indecision Signals: Reading Market Hesitation
Doji (1 candle, neutral) Open and close are nearly identical, producing a cross or plus sign. Variants include the Dragonfly Doji (long lower wick, bullish bias), Gravestone Doji (long upper wick, bearish bias), and Long-Legged Doji (extended wicks both directions). Doji formations are warning flags, not trade triggers — they signal that the current trend may be losing momentum, but require the next candle to confirm direction.
Harami (2 candles, neutral) A small candle contained entirely within the body of the preceding larger candle. Signals momentum is fading. The Harami is best used as an alert to tighten existing stops or reduce position size rather than to open a new trade in the opposite direction.
Continuation Signals: Confirming the Trend Has Legs
Three White Soldiers (3 candles, bullish) Three consecutive bullish candles, each opening within the prior body and closing at a new high. Signals strong sustained buying. Caution: if the three candles appear after an already extended move, they may signal exhaustion rather than continuation. Volume confirmation is particularly important here.
Three Black Crows (3 candles, bearish) Three consecutive bearish candles, each opening within the prior body and closing at a new low. Signals sustained selling pressure. Caution: same exhaustion risk as Three White Soldiers in reverse.
Disclosure: This page may contain affiliate links. We may earn a commission if you open an account through our links, at no extra cost to you.
Building pattern-recognition skill takes screen time across different market conditions. If you are not yet trading live, an HFM demo account lets you practise identifying and trading these patterns with real-time market data and zero financial risk.
What Changes When You Trade Forex Candlesticks Instead of Stocks
Forex markets operate around the clock from Sunday evening through Friday close. This continuous structure fundamentally alters how candlestick patterns behave compared to equity markets, where daily closes create overnight gaps.
Gap-dependent patterns common in stock analysis — such as gap-and-fill setups — rarely appear on intraday forex charts. Weekend gaps occur at the Sunday open but are typically small for major pairs. What replaces gaps as meaningful signals are session-to-session transitions, where liquidity shifts between Asian, European, and North American trading centres produce the kind of decisive candles that form reliable patterns.
How Session Timing Shifts Pattern Reliability
The same candlestick formation carries different weight depending on when it appears. This is specific to forex and rarely addressed in general pattern guides.
| Session | Liquidity Profile | Patterns Most Reliable | Patterns Least Reliable | Key Considerations |
|---|---|---|---|---|
| Asian (Tokyo/Sydney) | Lower volume, range-bound | Doji and indecision (accurately reflect low conviction) | Engulfing, Hammer (often produce false breakouts) | Narrow ranges create small candles; avoid acting on reversal signals without higher-timeframe confirmation |
| London Open | Rising volume, momentum surge | Engulfing, Hammer, Shooting Star | — | Opening momentum creates decisive candles; among the best windows for pattern-based entries |
| London–New York Overlap | Peak volume and liquidity | All high-conviction patterns (Engulfing, Morning/Evening Star) | Fewest false signals overall | Most reliable session for pattern signals; strongest confirmation environment |
| New York Close | Declining liquidity | Few — candles may be distorted | All — thin order flow produces unreliable wicks | Avoid acting on patterns forming near the Friday close or end of the New York session |
From Signal to Trade: Building a Plan Around a Pattern
Identifying a candlestick pattern is only the first step. Converting it into a trade requires confirmation, defined risk, and an honest assessment of whether conditions support the signal.
Layering Confirmation: Volume, Levels, and Indicators
Candlestick patterns perform best when layered with at least two additional confirmation sources:
Support and resistance — A reversal pattern forming at a well-established price level is substantially more meaningful than one appearing in open space. Check whether the pattern aligns with a prior swing high, swing low, or round number.
Moving averages — A 50-period or 200-period moving average provides trend context. A bullish reversal pattern is more credible when price is near a rising long-term average. Trading in the direction of the dominant trend improves the probability of any pattern-based entry.
RSI (Relative Strength Index) — RSI extremes (above 70 or below 30) add weight to reversal signals. An Evening Star coinciding with overbought RSI readings carries more conviction than the same pattern with RSI in neutral territory.
Volume and tick activity — While spot forex lacks centralized volume data, tick volume on MetaTrader 5 serves as a reasonable proxy. Higher tick volume during the formation candle suggests genuine participation rather than thin-market distortion.
The strongest trade setups combine a candlestick signal at a key level, aligned with the dominant trend, and confirmed by at least one momentum indicator.
Where to Place Your Stop-Loss and Target
Pattern anatomy provides natural reference points for trade management:
Hammer / Shooting Star — stop-loss beyond the wick extreme (below the lower wick for a Hammer, above the upper wick for a Shooting Star). This defines the level at which the pattern's thesis is invalidated.
Engulfing — stop-loss beyond the engulfing candle's full range (high for bearish, low for bullish). The pattern fails if price reverses through the candle that signalled conviction.
Morning / Evening Star — stop-loss beyond the extreme of the entire three-candle formation. This provides a wider stop but reflects the pattern's larger structure.
Target — the next significant swing level or support/resistance zone. As a baseline discipline, require a minimum risk-reward ratio of 1.5:1 before entering any pattern-based trade. If the distance to your target does not justify the risk, the setup is not worth taking regardless of how clean the pattern looks.
How Spread Size Affects Pattern Profitability
Spread is the cost most traders overlook when evaluating candlestick signals — yet it directly erodes profitability, especially for patterns built on small candle bodies.
| Pattern Type | Typical Signal Move | Spread Impact at 1 Pip | Spread Impact at 3 Pips | Practical Implication |
|---|---|---|---|---|
| Doji, Harami (small body) | 5–15 pips | 7–20% of move consumed | 20–60% of move consumed | Spread-sensitive; requires tight pricing to be tradeable |
| Hammer, Shooting Star (medium body) | 15–40 pips | 3–7% of move consumed | 8–20% of move consumed | Moderate sensitivity; viable on most account types |
| Engulfing, Morning Star (large body) | 30–80+ pips | 1–3% of move consumed | 4–10% of move consumed | Spread-robust; viable across account types and pairs |
According to HFM's published account specifications, variable spreads start from 0.0 pips on certain account configurations, with commission applying separately, and from 1 pip on the Premium Pro account type. The account tier you choose directly affects which patterns remain profitable after transaction costs. Smaller-body patterns like Doji and Harami formations become marginal or unprofitable when spreads widen — a critical consideration for traders comparing broker conditions or evaluating whether their current account type suits their pattern-based approach.
Common Mistakes That Turn Good Patterns Into Losing Trades
Acting on unconfirmed signals. Entering before the confirmation candle closes is the single most common error. A Hammer can morph into a full bearish candle in its final minutes. Wait for the pattern to complete and for the next candle to confirm direction.
Ignoring trend context. A bearish Engulfing pattern in a strong uptrend is likely a pullback signal, not a reversal. Trading against the dominant trend requires substantially more confirmation than trading with it.
Overtrading low-conviction formations. Not every Doji or Spinning Top warrants a trade. These indecision signals should trigger analysis, not automatic entries. Patience in waiting for high-conviction setups separates profitable pattern traders from those who generate constant commission costs.
Neglecting spread cost. A pattern signalling a 10-pip move is marginal at best when your spread is 2–3 pips. Always subtract spread cost from expected profit before deciding whether a setup meets your minimum risk-reward threshold.
Skipping the pre-trade checklist. A systematic approach prevents impulsive entries. Before every pattern-based trade, work through each item:
- Pattern identified and classified by type
- Trend context confirmed on a higher timeframe
- Support or resistance proximity assessed
- Volume or momentum confirmation checked
- Stop-loss level defined relative to pattern anatomy
- Target level defined at the next logical price zone
- Risk-reward ratio calculated — minimum 1.5:1 required
- Spread cost accounted for in profit calculation
- Position size calibrated to signal-strength tier
When Patterns Fail: Filtering False Signals
No candlestick pattern guarantees a specific outcome. Even well-formed Engulfing or Morning Star patterns produce false signals regularly enough that risk management — not prediction accuracy — determines long-term results.
Algorithmic and high-frequency trading have increased noise on very short timeframes, potentially reducing the reliability of single-candle patterns on sub-5-minute charts. Multi-candle formations on higher timeframes — 4-hour and daily — remain more robust because they reflect aggregated order flow that algorithmic systems themselves respond to.
Practical filters to reduce false entries:
- Require patterns to form at identifiable support or resistance levels rather than in open space
- Confirm with at least one additional indicator before entering
- Use higher timeframes for primary signals and lower timeframes only for entry refinement
- Avoid trading patterns during low-liquidity sessions or around major news releases that distort price action
- Track your personal hit rate per pattern type over a statistically meaningful sample of trades
Practising Candlestick Analysis on a Demo Account
Pattern recognition improves with deliberate practice under varied market conditions, and a demo account removes financial risk from the learning process.
Week 1–2: Focus on daily and 4-hour charts. Identify patterns from this guide without trading them. Note the context: trend direction, nearby support/resistance, and session timing. Compare what happened after each pattern formed against what the signal predicted.
Week 3–4: Begin executing demo trades based on the pre-trade checklist. Record every entry: the pattern type, confirmation factors present, stop and target levels, spread at entry, and outcome. A simple spreadsheet tracking these variables will reveal which patterns work best for your style and which sessions produce the most reliable signals.
Week 5–8: Expand to 1-hour and 15-minute charts. Compare your results across timeframes. Most traders find that higher timeframes produce fewer but more reliable signals, while lower timeframes generate more opportunities with a lower success rate per trade.
This structured approach builds genuine skill rather than the false confidence that comes from recognizing patterns in hindsight on historical charts.
Platform Tools for Scanning and Alerting on Patterns
MetaTrader 5, available on HFM trading accounts, provides native candlestick charting with customizable colour schemes, timeframe selection from 1-minute to monthly, and built-in drawing tools for marking support and resistance levels.
The platform's marketplace includes both free and paid pattern-recognition indicators that automatically identify formations and mark them on your chart. Quality varies significantly between tools, so evaluate any indicator against your own manual identification before relying on its signals.
For multi-pair monitoring, price alerts at key support and resistance levels notify you when candlestick patterns are likely forming — allowing you to inspect the chart and confirm the pattern manually rather than depending entirely on automated detection.
Quick-Reference Pattern Table
| Pattern | Candles | Direction | Signal Strength | Best Timeframes | Session Sensitivity | Spread Sensitivity |
|---|---|---|---|---|---|---|
| Hammer | 1 | Bullish reversal | Medium | 1H, 4H, Daily | High | Medium |
| Shooting Star | 1 | Bearish reversal | Medium | 1H, 4H, Daily | High | Medium |
| Bullish Engulfing | 2 | Bullish reversal | High | 1H, 4H, Daily | Medium | Low |
| Bearish Engulfing | 2 | Bearish reversal | High | 1H, 4H, Daily | Medium | Low |
| Morning Star | 3 | Bullish reversal | High | 4H, Daily | Medium | Low |
| Evening Star | 3 | Bearish reversal | High | 4H, Daily | Medium | Low |
| Doji (variants) | 1 | Indecision | Low | All | High | High |
| Harami | 2 | Indecision | Low | 1H, 4H, Daily | Medium | High |
| Three White Soldiers | 3 | Bullish continuation | Medium-High | 4H, Daily | Low | Low |
| Three Black Crows | 3 | Bearish continuation | Medium-High | 4H, Daily | Low | Low |
Pattern Selector by Trading Style
| Trading Style | Recommended Patterns | Typical Timeframes | Key Rationale |
|---|---|---|---|
| Scalper | Engulfing, Hammer | 5M, 15M | Quick signals; large-body patterns tolerate spread cost on fast entries |
| Day Trader | Engulfing, Morning/Evening Star, Hammer | 15M, 30M, 1H | Balance of signal frequency and reliability; confirmation before candle close |
| Swing Trader | Morning/Evening Star, Engulfing, Three Soldiers/Crows | 4H, Daily | Multi-candle confirmation; higher timeframe reduces noise and false signals |
| Position Trader | Engulfing, Morning/Evening Star | Daily, Weekly | Fewer but higher-conviction signals; intraday noise irrelevant to multi-week holds |
Frequently Asked Questions
Which candlestick patterns are most reliable for forex trading? Multi-candle formations such as Engulfing patterns and Morning/Evening Star tend to carry higher conviction than single-candle signals like Hammer or Shooting Star, because additional candles provide built-in confirmation. Reliability improves further when patterns form at key support or resistance levels with confirming volume.
How many candlestick patterns do I actually need to learn? Most active traders rely on 5–8 well-understood patterns rather than encyclopaedic knowledge. Mastering a small set deeply — understanding when each works, when it fails, and how it interacts with spread and session timing — produces better results than surface-level familiarity with 30+ formations.
Do candlestick patterns work on all timeframes? Patterns form on every timeframe, but shorter timeframes produce significantly more noise. Sub-5-minute patterns are heavily affected by algorithmic trading activity and carry lower signal quality. The 4-hour and daily charts offer the most reliable balance of signal frequency and accuracy for most traders.
Should I use candlestick patterns alone or with other indicators? Patterns should not be used in isolation. Combining them with support/resistance levels, moving averages, and momentum indicators like RSI creates a layered confirmation framework that substantially improves trade selection. Patterns tell you what price did; indicators help confirm whether the move has further potential.
How do forex candlesticks differ from stock candlesticks? The 24-hour forex market eliminates most overnight gaps that equity traders rely on for gap-based patterns. Forex patterns form through session-to-session liquidity transitions rather than market open/close gaps, making session timing a uniquely important factor in forex candlestick analysis.
Risk Warning
CFDs and leveraged forex products are complex instruments and carry a high risk of losing money rapidly due to leverage. Consider whether you understand how these products work and whether you can afford to take the high risk of losing your capital. Check the entity, terms and protections that apply in your jurisdiction before trading.
Risk warning: CFDs and leveraged forex products are complex instruments and carry a high risk of losing money rapidly due to leverage. Retail investor accounts lose money when trading CFDs with most providers; the exact percentage varies by HFM entity and account type. You should consider whether you understand how CFDs work and whether you can afford to take the high risk of losing your money. Check the entity, terms and investor protections that apply in your jurisdiction before opening an account or trading.
Ready to Start Your Funded Trading Journey?
Join traders backed by $11M+ in verified payouts and a 4.7/5 Trustpilot rating. Compare HashHedge challenge plans, drawdown rules, and payout terms — apply code ha25 for the current discount.
Risk disclaimer: Challenge fees are non-refundable if you breach the rules. Prop trading involves significant financial risk. Past performance in a simulated environment does not guarantee results on a funded account. Only purchase if you understand the rules fully and can afford to lose the fee. Affiliate disclosure: HNL Growth earns a commission when you purchase a HashHedge challenge through links on this page.