Cup and Handle Pattern: Entry, Target and Failure Rate
The cup and handle is a bullish continuation chart pattern made up of two parts: a rounded 'cup' that forms as price dips and then recovers in a U-shape, followed by a shorter, shallower 'handle'...
Reviewed using our forex & CFD broker review methodology
Checked on: 2026-08-17 | Broker terms, regulation, and pricing can change. Always verify at the official PU Prime site before opening an account.
Affiliate Disclosure: HNL Growth may earn a commission if you open an account through our links, at no additional cost to you. Risk Warning: CFDs and leveraged forex products are complex instruments and carry a high risk of losing money rapidly due to leverage. 62.2% of retail investor accounts lose money when trading CFDs with this provider. Trading forex and CFDs may not be suitable for all investors. Consider your objectives, experience, and risk appetite before trading, and ensure you understand the risks involved. Broker Disclosure: PU Prime is a live, regulated multi-entity broker (not a simulated prop-firm evaluation) — trades are executed with real capital in live market conditions, subject to normal market risk. Which PU Prime entity holds your account depends on your country of residence and determines your leverage cap and protections.
Last verified: August 2026 | Editorial Team
Cup and Handle Pattern: Entry, Target and Failure Rate
The cup and handle is a bullish continuation chart pattern made up of two parts: a rounded "cup" that forms as price dips and then recovers in a U-shape, followed by a shorter, shallower "handle" where price pulls back and consolidates near the cup's high. Traders watch for a breakout above the handle's resistance, ideally on stronger volume, as the signal that the prior uptrend may resume. It is a probabilistic setup, not a guarantee — false breakouts and failed handles are common, particularly in choppy markets or on leveraged instruments where spread and slippage can distort your actual entry price.
This guide breaks down the anatomy of the pattern, walks through a worked numerical example, and covers where it tends to go wrong — so you can evaluate it critically rather than treating it as a shortcut to profit.
What the Cup and Handle Pattern Is, in Plain Terms
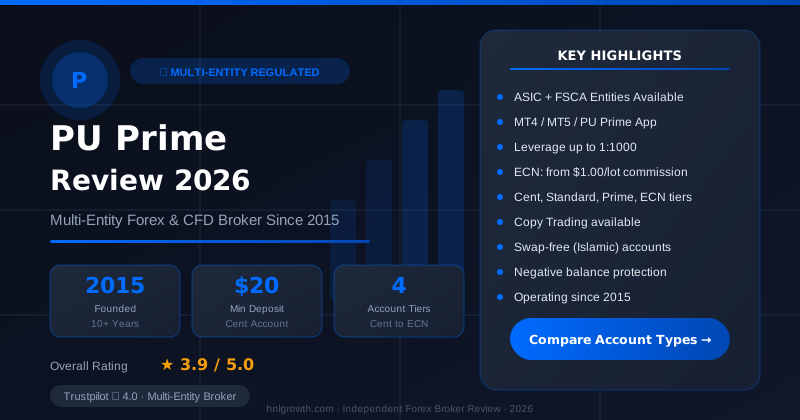
PU Prime — Multi-Entity Forex & CFD Broker
ASIC (AU) + FSCA (ZA) entities available · $20 min deposit (Cent) · MT4, MT5, PU Prime App · 4 account tiers
Picture a price chart where an asset is trending upward, then drifts lower, rounds out at the bottom, and climbs back up to roughly where it started. That rounded dip-and-recovery is the "cup." Once price gets back near its old high, it often pauses and drifts sideways or slightly down in a tighter range before pushing higher again — that smaller pullback is the "handle."
The idea, originally popularised in equity chart analysis, is that the cup represents a period where sellers gradually lose control and buyers slowly regain it, while the handle represents a final shakeout of short-term sellers before the trend continues. A breakout above the handle's resistance level is read as confirmation that buyers are back in charge.
It's worth being upfront about a limitation here: there is no single, universally agreed definition of where a cup or handle "officially" starts and ends. Different traders will draw slightly different boundaries on the same chart. That subjectivity is a real constraint of pattern-based analysis, not a flaw unique to this pattern, and it's one reason experienced traders treat it as one input among several rather than a standalone signal.
Anatomy of the Pattern: Cup, Handle, Breakout, and Volume
Each component of the pattern plays a specific role in how the setup is read.
| Component | What to look for | Why it matters |
|---|---|---|
| The cup | A rounded (not V-shaped) decline and recovery, typically retracing a moderate portion of the prior move, with the right side reaching back close to the left side's high | A smooth, gradual recovery suggests steady accumulation; a sharp V-shape suggests panic-driven moves that are less reliable as continuation signals |
| The handle | A shorter, shallower pullback near the cup's high, usually retracing only a fraction of the cup's total depth | A handle that stays shallow suggests sellers are weak; a handle that digs deep back into the cup undermines the bullish case |
| The breakout point | Price closing above the handle's resistance (the recent swing high within the handle) | This is the trigger level most traders use to consider entering, since it suggests the consolidation has resolved upward |
| Volume | Ideally lower volume during the handle's formation and a pickup in volume on the breakout candle | Rising volume on the breakout is generally read as stronger confirmation; a breakout on thin volume is more prone to failing or reversing |
None of these elements works in isolation. A textbook-looking cup with a messy, deep handle and no volume pickup on the breakout is a materially weaker setup than one where all four elements line up.
A Validity Checklist: Textbook Setup vs. Likely-to-Fail Setup
Before treating a cup and handle as a legitimate signal, it helps to run it against a short checklist.
| Characteristic | Supportive sign | Warning sign |
|---|---|---|
| Cup shape | Smooth, rounded U-shape over a reasonable number of candles | Sharp V-shaped spike down and back up, or a flat-bottomed rectangle |
| Cup depth | Moderate retracement relative to the preceding uptrend | Extremely deep retracement that erases most of the prior trend |
| Handle depth vs. cup depth | Handle retraces roughly a third or less of the cup's depth | Handle retraces half or more of the cup's depth, or breaks below the cup's midpoint |
| Handle duration | Noticeably shorter than the time it took to form the cup | Handle drags on for as long as, or longer than, the cup itself |
| Volume in the handle | Volume tapers off during the handle's consolidation | Volume stays elevated or spikes erratically during the handle |
| Volume on breakout | Clear increase in volume on the breakout candle | Breakout occurs on flat or below-average volume |
| Broader trend context | Pattern forms within an established uptrend | Pattern forms in a downtrend or a sideways, directionless market |
If several "warning sign" boxes are ticked, the setup is weaker and arguably not a genuine cup and handle at all — it's just noise that happens to resemble one in hindsight.
Worked Example: Identifying Entry, Stop-Loss and Target
The following is a hypothetical, illustrative example using round numbers — it is not a live trade recommendation or a prediction of how any specific instrument will behave.
Say a stock or CFD is trading in an uptrend and reaches a high of 100.00. It then declines to a low of 85.00 (a cup depth of 15.00) before rounding back up to retest the 100.00 area. From there, instead of breaking out immediately, price pulls back into a handle, dipping to 95.00 before stabilising — a handle depth of 5.00, which is exactly one-third of the cup's 15.00 depth, comfortably within the "supportive" range from the checklist above.
A trader watching this setup might define their levels as follows:
| Element | Level | Calculation |
|---|---|---|
| Cup high / breakout resistance | 100.00 | Prior swing high, retested twice |
| Cup low | 85.00 | Lowest point of the rounded decline |
| Handle low | 95.00 | Pullback low within the handle |
| Entry (on breakout) | 100.10 | Small buffer above the handle resistance to reduce false-breakout risk |
| Stop-loss | 94.50 | Placed just below the handle low, allowing for minor noise |
| Measured-move target | 115.10 | Entry price + cup depth (100.10 + 15.00) |
| Risk (entry to stop) | 5.60 | 100.10 − 94.50 |
| Reward (entry to target) | 15.00 | 115.10 − 100.10 |
| Resulting risk:reward | Approximately 1:2.7 | Reward ÷ risk |
The "measured move" projection — adding the cup's depth to the breakout point — is a common convention for setting a target, but it's an approximation drawn from the pattern's geometry, not a statistical prediction of where price will actually go. In practice, price may fall short of the target, overshoot it, or reverse before reaching it. The stop-loss placement is what actually defines your risk on the trade; the target is a planning reference, not a guarantee.
Two things this example deliberately shows: the entry is placed with a small buffer above resistance (not exactly at it), and the stop is placed with a small buffer below the handle low (not exactly at it). Placing stops or entries at the precise round number where everyone else is watching is one of the more common ways beginners get caught by brief, noisy spikes.
How to Practise Pattern Recognition on a Demo Account
Because the cup and handle depends on pattern recognition built through repetition, practising on a demo account before risking real capital is a reasonable step for most beginners. A simple three-part exercise:
- Scan historical charts for candidate setups. Using a demo account's charting tools, look back through several months of price history on a few liquid instruments and mark any formations that resemble a cup and handle using the checklist above.
- Mark your hypothetical entry, stop, and target on each one before scrolling forward, exactly as in the worked example — write down the specific price levels rather than eyeballing it after the fact.
- Compare your marked levels against what actually happened next, and log the outcome (breakout followed through, breakout failed, handle broke down, pattern never resolved) in a simple journal. Over enough repetitions, this builds a realistic sense of how the pattern behaves on the specific instruments and timeframes you actually trade, rather than relying on general assumptions.
This kind of forward and backward testing on a demo account uses virtual funds while still reflecting live market pricing, so no capital is at risk during the learning phase.
Disclosure: This page may contain affiliate links. We may earn a commission if you open an account through our links, at no extra cost to you.
If you want to work through this exercise yourself, you can open a PU Prime account and start on a demo before deciding whether to fund a live account. The account opening process takes about 10 to 15 minutes, and a demo account is typically available while any live-account verification is still being processed, according to PU Prime's account opening guide.
Where This Pattern Tends to Fail (and Why)
No credible, checkable source publishes a single universal failure rate for the cup and handle pattern, and any article that states one as a hard statistic is presenting an invented number. What can be said, based on general technical-analysis literature and the mechanics of the pattern itself, is that failure is common enough that risk management has to be treated as essential, not optional. The main failure modes are:
- False breakouts. Price closes above the handle's resistance, traders enter, and then price reverses back into the handle or the cup without follow-through. This is especially common around news events or in low-liquidity sessions.
- Handle breakdown instead of breakout. Instead of resolving upward, the handle breaks below its own low, invalidating the bullish setup entirely. This is why a stop-loss below the handle low matters — it's the point at which the original thesis is wrong.
- Pattern forming in the wrong context. A cup-like shape that appears during a downtrend or in a directionless, range-bound market carries much less weight than one forming within an established uptrend, since the pattern's logic depends on it being a continuation of existing bullish momentum, not a reversal signal from a decline.
- Low-volume breakouts. A breakout that isn't accompanied by increased participation is more prone to fading, since there's less evidence that new buyers are actually driving the move rather than a handful of orders temporarily pushing through a thin order book.
- Slippage and spread distortion on leveraged instruments. On CFDs, the effective entry and exit prices you get can differ from the exact chart level you planned around, particularly during volatile breakouts, which changes the real risk:reward of a trade versus the theoretical one drawn on a chart.
Who This Approach Is Not Well Suited For
Pattern-based trading in general, and the cup and handle specifically, doesn't fit every trading style or every trader's circumstances equally well.
- Very short-term scalpers working on one-minute or tick charts will rarely see clean cup-and-handle formations, since the pattern typically needs enough candles to form a recognisable rounded shape — it's better suited to swing-style timeframes than ultra-short holding periods.
- Traders on illiquid or thinly traded instruments face a higher risk of false signals, because low volume makes it harder to distinguish a genuine breakout from a temporary price gap caused by a single large order.
- Beginners without stop-loss discipline are the group most exposed to this pattern's failure modes, since the entire risk-management logic of the setup depends on actually honouring a predefined stop rather than waiting in hope that a failed breakout reverses back in their favour.
- Traders expecting a high-certainty signal are likely to be disappointed. This is a probabilistic tool for structuring an idea, not a system that removes uncertainty from a trade.
Common Mistakes Beginners Make When Trading This Pattern
| Do | Don't |
|---|---|
| Wait for a confirmed close above the handle resistance before acting | Enter as soon as price approaches the resistance line, anticipating the breakout |
| Check volume on the breakout candle relative to recent average volume | Ignore volume entirely and rely on price shape alone |
| Confirm the pattern is forming within a broader uptrend | Force a "cup and handle" label onto a random dip-and-recovery in a sideways or declining market |
| Place the stop-loss below the handle low, with a small buffer for noise | Place an overly tight stop right at the handle low or breakout line, where normal price noise can trigger it |
| Treat the measured-move target as a planning reference | Assume the target will definitely be reached and hold the position rigidly regardless of new information |
| Journal every setup, including the ones that failed | Only remember and review the trades that worked, which skews your sense of how reliably the pattern has performed in your own sample |
The most consequential mistake on this list is probably the last one on each side. Selectively remembering winning setups while forgetting failed ones is a well-documented way traders overestimate a pattern's historical performance in their own sample — and by extension, their confidence going forward.
FAQ
Is the cup and handle pattern reliable? It's a widely referenced pattern in technical analysis, but "reliable" is relative. No independently checkable source publishes a definitive success or failure rate for it, and outcomes vary by instrument, timeframe, and market conditions. Treat it as one input for structuring a trade idea and managing risk, not as a high-certainty signal.
Is the cup and handle bullish or bearish? It's a bullish continuation pattern, meaning it suggests an existing uptrend may resume after a pause. Some traders also discuss an inverted version for downtrends, but that's a distinct pattern with different implications and isn't the focus of this guide.
What timeframe works best for spotting this pattern? The pattern can appear on any timeframe, from intraday charts to weekly charts, but it generally needs enough price history to form a visibly rounded cup and a distinct handle. Very short timeframes (like one-minute charts) tend to produce noisier, less clearly defined shapes.
How do I know if a breakout is real or a fakeout? There's no way to know with certainty in advance. Common practices include waiting for a confirmed candle close above resistance rather than an intraday touch, and checking whether volume increased on the breakout compared to the handle. Neither eliminates false-breakout risk, which is why a stop-loss remains necessary regardless of how convincing a breakout looks.
What happens if the handle breaks down instead of breaking out? That invalidates the bullish setup. If your stop-loss is placed below the handle low, as in the worked example above, this is the scenario it's designed to protect against.
Do I need special software to spot cup and handle patterns? Standard charting tools on most trading platforms, including trend lines and volume indicators, are sufficient to identify and mark this pattern manually. It's fundamentally a visual, price-and-volume pattern rather than one that requires a specific indicator.
What to Verify Yourself Before Trading
Since no first-hand testing results are presented in this guide, use this neutral checklist when evaluating any broker or platform for practising pattern-based strategies:
- Confirm which specific entity regulates the broker in your jurisdiction and what that licence actually covers, rather than assuming blanket global protection. PU Prime's regulatory entities and licences are listed on its regulation page, and coverage differs by entity.
- Check the actual spreads and commissions on the specific account type and instrument you plan to trade, since these vary between account tiers. PU Prime publishes indicative spreads and costs by account type on its spreads and costs page, though it notes these values are for reference and the platform itself shows the most accurate live figures.
- Confirm minimum deposit, verification requirements, and funding methods directly with the broker's own account opening guide before assuming any figure quoted elsewhere is current.
- If you've seen claims on forums or review sites about execution speed, withdrawal times, or slippage, treat those as prompts to ask the broker directly or test cautiously on a demo account first, not as verified facts.
Risk Warning
Risk warning: CFDs and leveraged forex products are complex instruments and carry a high risk of losing money rapidly due to leverage. Consider whether you understand how these products work and whether you can afford to take the high risk of losing your capital. Check the entity, terms and protections that apply in your jurisdiction before trading. Chart patterns like the cup and handle are analytical tools based on historical price behaviour and do not predict future price movement with certainty; past formations, whether successful or failed, are not indicative of how any future setup will resolve.
Ready to Compare PU Prime Account Types?
PU Prime is a multi-entity broker — ASIC (Australia) and FSCA (South Africa) regulated entities offer stronger oversight, while most international clients are onboarded to the FSA Seychelles or FSC Mauritius entities. Four account tiers (Cent, Standard, Prime, ECN) range from a $20 minimum deposit to full ECN pricing.
Risk disclaimer: PU Prime is a live, regulated multi-entity broker — trading forex and CFDs is done with real capital under normal market risk (this is not a simulated prop-firm evaluation). PU Prime operates under multiple separate licenses (ASIC, FSCA, FSA Seychelles, FSC Mauritius); which entity holds your account depends on your country of residence and determines your leverage cap and protections — confirm this before funding. CFDs and leveraged forex products are complex instruments and carry a high risk of losing money rapidly due to leverage; 62.2% of retail investor accounts lose money when trading CFDs with this provider. Consider whether you understand how CFDs/forex work and whether you can afford the high risk of losing your money. Affiliate disclosure: HNL Growth earns a commission when you open a PU Prime account through links on this page.