Descending Triangle Pattern: How to Trade It
A descending triangle is a bearish continuation chart pattern made up of a flat horizontal support line and a downward-sloping resistance line connecting a series of lower highs. It typically forms...
Reviewed using our forex & CFD broker review methodology
Checked on: 2026-08-17 | Broker terms, regulation, and pricing can change. Always verify at the official PU Prime site before opening an account.
Affiliate Disclosure: HNL Growth may earn a commission if you open an account through our links, at no additional cost to you. Risk Warning: CFDs and leveraged forex products are complex instruments and carry a high risk of losing money rapidly due to leverage. 62.2% of retail investor accounts lose money when trading CFDs with this provider. Trading forex and CFDs may not be suitable for all investors. Consider your objectives, experience, and risk appetite before trading, and ensure you understand the risks involved. Broker Disclosure: PU Prime is a live, regulated multi-entity broker (not a simulated prop-firm evaluation) — trades are executed with real capital in live market conditions, subject to normal market risk. Which PU Prime entity holds your account depends on your country of residence and determines your leverage cap and protections.
Last verified: August 2026 | Editorial Team
Descending Triangle Pattern: How to Trade It
A descending triangle is a bearish continuation chart pattern made up of a flat horizontal support line and a downward-sloping resistance line connecting a series of lower highs. It typically forms during a pause in a downtrend and signals that sellers are gradually gaining control while buyers keep defending the same price floor. Most descending triangles resolve with a breakdown below support, though the pattern can occasionally show up near the bottom of a downtrend as part of a reversal. For a beginner, the practical takeaway is simple: learn to spot the two-trendline structure, wait for a volume-confirmed close beyond support before acting, and manage the trade with a predefined stop-loss and target rather than trading the shape on its own.
Disclosure: This page may contain affiliate links. We may earn a commission if you open an account through our links, at no extra cost to you.
What a descending triangle is, in plain terms
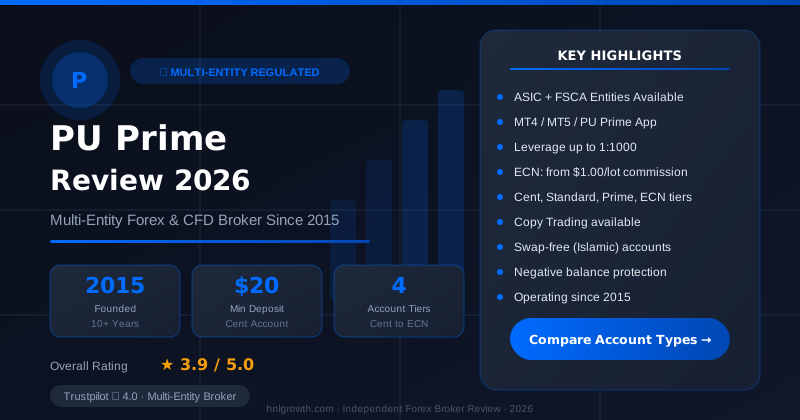
PU Prime — Multi-Entity Forex & CFD Broker
ASIC (AU) + FSCA (ZA) entities available · $20 min deposit (Cent) · MT4, MT5, PU Prime App · 4 account tiers
Picture a market that keeps bouncing off the same support price, but each rally toward the top fails a little lower than the last one. Draw a flat line under the lows and a downward-sloping line over the highs, and the two lines converge toward a point on the right of the chart. That converging shape is the descending triangle.
The pattern reflects a specific tug-of-war. Buyers are stepping in at the same level each time, which is why support holds. But sellers are getting more aggressive, selling into every rally at a lower price than before. That combination usually means selling pressure is winning the argument, which is why the pattern is classified as bearish in most textbooks and why it's generally treated as a continuation setup when it appears inside an existing downtrend.
It's worth being precise here rather than absolute: the descending triangle is not a guarantee of a breakdown. It can occasionally appear near the bottom of a prior downtrend and resolve upward if buying pressure suddenly overwhelms sellers. The direction of the confirmed breakout, not the shape of the pattern by itself, is what actually tells you which way the market is going.
The anatomy of the pattern
Three components define a descending triangle:
- Flat horizontal support. Price repeatedly touches roughly the same low and bounces. This is the floor buyers are defending.
- Descending resistance. A trendline connecting a series of lower highs, showing that each rally attempt is weaker than the one before it.
- The convergence point (apex). The area where the two lines would theoretically meet if the pattern kept compressing. In practice, price usually breaks out before reaching the apex.
As the triangle develops, the trading range narrows. That squeeze is a natural byproduct of sellers pressing lower highs while buyers hold the same floor, and it's usually accompanied by declining volume, since fewer participants want to commit capital while direction is unclear. When volume returns with a breakout, it's read as a sign that new participants have decided the standoff is over.
A simple checklist for spotting it with confidence
Beginners often mistake a random cluster of lower highs and a flat-ish low for a valid descending triangle. A short checklist reduces false positives:
| Criterion | What to look for |
|---|---|
| Downtrend or consolidation context | The pattern should follow a clear prior decline (continuation case) or sit at the base of one (rare reversal case). A descending triangle appearing out of nowhere in a strong uptrend is less meaningful. |
| Touch count | At least two clear touches on the flat support line and at least two on the descending resistance line, ideally three on each for a more reliable structure. |
| Volume behavior | Volume should generally taper off as the pattern forms, reflecting reduced participation during the standoff. |
| Breakout confirmation | Wait for a full candle close beyond support (or, less commonly, resistance) accompanied by a visible pickup in volume, rather than a brief intraday poke through the line. |
If a setup fails two or more of these criteria, treat it as a lower-confidence pattern rather than discarding your analysis altogether.
Worked example: reading the pattern step by step
The numbers below are illustrative only, built to show the mechanics of the pattern. They are not a historical trade record and not a forecast for any real instrument.
Suppose a currency pair has been in a gentle downtrend and starts consolidating. Over several weeks, price repeatedly finds support around 1.1000 and rallies, but each rally peak is lower than the last: first 1.1150, then 1.1090, then 1.1050. Volume shrinks noticeably during this consolidation. Eventually price closes below 1.1000 on a session where volume clearly increases compared to the preceding weeks.
| Element | Illustrative value |
|---|---|
| Flat support | 1.1000 |
| Highest point of resistance (start of triangle) | 1.1150 |
| Triangle height | 1.1150 − 1.1000 = 150 pips |
| Breakout (breakdown) price | 1.0995 (confirmed close below support) |
| Illustrative stop-loss | 1.1055 (above the most recent lower high) |
| Illustrative profit target | 1.0995 − 150 pips = 1.0845 |
| Resulting risk | 60 pips |
| Resulting reward (to target) | 150 pips |
| Risk-reward ratio | Approximately 1:2.5 |
The target here is calculated with the "triangle height" method: measure the vertical distance between the first resistance touch and the flat support, then project that same distance downward from the breakout point. It's a widely used estimate, but it's a projection based on pattern geometry, not a guaranteed outcome. Price can stall well before reaching it, or it can travel much further if a broader trend takes over.
How to think about entries: waiting for confirmation
The single most common beginner error with this pattern is entering the moment price touches or briefly dips below support, rather than waiting for a full confirmed close beyond it. A wick through support followed by a quick recovery back inside the range is a common trap, especially on lower timeframes where noise is more frequent.
A more disciplined approach is to wait for a candle to close beyond support on the timeframe you're analyzing, check that volume increased on that move relative to the recent average, and only then consider an entry, understanding that the price may already have moved some distance from the exact breakout level. That's a reasonable trade-off: entering slightly later in exchange for a lower chance of reacting to a false signal.
Once you've studied the mechanics, the safest way to build the pattern-recognition skill without risking money is to work through live and historical charts on a PU Prime demo account, where you can mark up support and resistance lines, watch how volume behaves as triangles form, and get a feel for how often breakouts hold versus fail, before ever committing real capital.
Setting a stop-loss and a target: using triangle height without treating it as guaranteed
Two placements are common for the stop-loss on a bearish descending-triangle breakdown:
- Above the most recent lower high on the resistance trendline, which gives the trade some room to breathe but risks a wider loss if the setup fails.
- A smaller buffer just above the broken support level, which limits risk but increases the chance of being stopped out by normal post-breakout volatility.
Neither placement is objectively correct. The choice depends on your risk tolerance and the volatility of the instrument you're trading. What matters more than the exact distance is that the stop is decided before you enter, not adjusted emotionally after the trade is open.
For the target, the triangle-height projection described above is the standard starting point. Many traders also treat it as a first target and manage part of the position beyond that level if the broader trend supports further movement. Either way, the number should be understood as a probability-weighted estimate drawn from the pattern's geometry, not a promise of where price will stop.
Where this pattern struggles
Descending triangles fail more often than beginner-oriented explanations sometimes suggest, and understanding why helps set realistic expectations:
False breakdowns. Price closes below support, triggers stop-loss orders and short entries, then reverses back above the level. This is more common on thin volume, where a small number of large orders can push price through a level without genuine broad participation.
Macro and news overrides. A scheduled economic release, earnings report, or unexpected headline can move price sharply in either direction regardless of what the chart pattern implied. Technical structure describes probability, not certainty, and it can be overridden by fundamental catalysts at any moment.
Low-volume environments. In markets or sessions with thin liquidity, the "volume confirmation" signal becomes less reliable because baseline volume is already low, making it harder to distinguish a genuine surge from routine noise.
None of this means the pattern is useless. It means outcomes should be framed in terms of probability and managed with a stop-loss, rather than treated as a mechanical certainty.
Who this approach is not for
Trading descending triangles is not well suited to:
- Traders on very short timeframes (for example, one-minute or five-minute charts), where price noise creates frequent false patterns and breakouts that reverse almost immediately.
- Illiquid instruments, where wide spreads and inconsistent volume make both the pattern and its volume confirmation harder to trust.
- Beginners without a predefined risk plan. If you don't know your stop-loss and position size before entering, the pattern itself won't protect you from a large loss.
- Anyone expecting a guaranteed outcome. This is a probabilistic tool for reading market structure, not a system that removes the risk of loss.
Common mistakes beginners make with this pattern
- Entering before confirmation. Reacting to the first touch of support or the first small dip below it, rather than waiting for a confirmed close and a volume increase.
- Misidentifying the pattern. Confusing a descending triangle with a symmetrical or ascending triangle, which carry different implied bias (see the comparison below).
- Ignoring the broader context. Trading the pattern in isolation without checking whether a news event, earnings date, or major macro release is imminent.
- Redrawing trendlines after the fact. Adjusting the support or resistance line retroactively to make a messy chart fit the "textbook" shape. If a pattern only looks valid after you've redrawn the lines several times, it's worth treating it with more skepticism.
- Sizing the position too large. Using the triangle-height target to justify an oversized position because the projected reward looks attractive, without adjusting size to the actual stop-loss distance.
Descending vs ascending vs symmetrical triangles
Beginners frequently ask how to tell these three patterns apart, since they share a similar converging shape.
| Pattern | Structure | Typical bias | Typical breakout direction |
|---|---|---|---|
| Descending triangle | Flat support, descending resistance (lower highs) | Bearish continuation | Usually downward, occasionally upward |
| Ascending triangle | Flat resistance, ascending support (higher lows) | Bullish continuation | Usually upward, occasionally downward |
| Symmetrical triangle | Descending resistance and ascending support converging together | Neutral | Can break either way; direction depends on the prevailing trend and confirmation |
The key distinction to remember: a descending triangle leans bearish because of the flat floor and falling ceiling, an ascending triangle leans bullish for the mirror-image reason, and a symmetrical triangle carries no inherent directional bias on its own. Treating a symmetrical triangle as equivalent to a descending triangle, or assuming a downward-sloping upper line always means the same thing regardless of where the lower boundary sits, is a common source of misidentification.
Practising it without risking capital
Because pattern trading depends heavily on repetition, the most efficient way to build the skill is to review as many real chart examples as possible before trading with actual funds. A demo account lets you do this against live market prices without financial risk: you can mark up potential descending triangles as they form, note whether volume behaves as expected, and track whether the eventual breakout holds or reverses.
Working through this cycle several times, on more than one instrument and timeframe, gives you a much clearer sense of how the pattern behaves in practice than reading about it once. When you're ready to test the process in a low-risk way, you can open a demo account with PU Prime and practice identifying and reacting to descending triangles using real-time pricing before deciding whether to fund a live account.
FAQ
What distinguishes a descending triangle from an ascending or symmetrical triangle? A descending triangle has a flat support line and a falling resistance line, giving it a bearish lean. An ascending triangle is the mirror image (flat resistance, rising support), leaning bullish. A symmetrical triangle has both lines converging toward each other and carries no default directional bias until it breaks out.
How many touches are needed to confirm the pattern is valid? As a practical minimum, look for at least two clear touches on both the support and resistance lines. Three or more touches on each generally makes the structure more convincing, though no fixed number guarantees the pattern will resolve as expected.
What volume signals a genuine breakout versus a false one? There's no single universal threshold, but a breakout accompanied by a visible increase in volume relative to the tapering volume seen during the pattern's formation is generally viewed as stronger confirmation than a breakout on flat or declining volume.
Can a descending triangle appear in an uptrend or act as a reversal pattern? It's uncommon, but it can appear near the bottom of a downtrend and occasionally resolve with an upward breakout if buying pressure unexpectedly overwhelms sellers. This is why waiting for a confirmed close in either direction matters more than assuming the pattern's usual bearish tendency will play out.
Why do some breakouts fail even when the pattern looks textbook-correct? Common causes include thin volume creating a false breakdown, a news or earnings catalyst overriding the technical setup, and traders acting on the first touch of a level instead of waiting for a confirmed close.
Should I enter as soon as price touches or dips below support? Waiting for a full close beyond the level, ideally with a volume increase, is a more disciplined approach than reacting to the first touch, which is frequently a false signal.
Does the timeframe matter? Yes. Patterns that form on longer timeframes, such as daily or weekly charts, are generally considered more meaningful than the same shape appearing on very short intraday charts, where noise produces far more false patterns.
Risk warning
Risk warning: CFDs and leveraged forex products are complex instruments and carry a high risk of losing money rapidly due to leverage. Consider whether you understand how these products work and whether you can afford to take the high risk of losing your capital. Check the entity, terms and protections that apply in your jurisdiction before trading. Chart patterns like the descending triangle describe historical probability tendencies, not certainties, and no analytical method removes the risk of loss. For details on the entities that regulate PU Prime and which apply to your region, see the PU Prime regulation page. For current spread and cost information by account type, see PU Prime's spreads and costs page.
Ready to Compare PU Prime Account Types?
PU Prime is a multi-entity broker — ASIC (Australia) and FSCA (South Africa) regulated entities offer stronger oversight, while most international clients are onboarded to the FSA Seychelles or FSC Mauritius entities. Four account tiers (Cent, Standard, Prime, ECN) range from a $20 minimum deposit to full ECN pricing.
Risk disclaimer: PU Prime is a live, regulated multi-entity broker — trading forex and CFDs is done with real capital under normal market risk (this is not a simulated prop-firm evaluation). PU Prime operates under multiple separate licenses (ASIC, FSCA, FSA Seychelles, FSC Mauritius); which entity holds your account depends on your country of residence and determines your leverage cap and protections — confirm this before funding. CFDs and leveraged forex products are complex instruments and carry a high risk of losing money rapidly due to leverage; 62.2% of retail investor accounts lose money when trading CFDs with this provider. Consider whether you understand how CFDs/forex work and whether you can afford the high risk of losing your money. Affiliate disclosure: HNL Growth earns a commission when you open a PU Prime account through links on this page.