Doji Candlestick: What It Signals and How to Trade It
A doji candlestick forms when a session's opening and closing prices are virtually identical, leaving little or no visible body between them. It records a session in which price moved up and down but...
Reviewed using our forex & CFD broker review methodology
Checked on: 2026-08-17 | Broker terms, regulation, and pricing can change. Always verify at the official PU Prime site before opening an account.
Affiliate Disclosure: HNL Growth may earn a commission if you open an account through our links, at no additional cost to you. Risk Warning: CFDs and leveraged forex products are complex instruments and carry a high risk of losing money rapidly due to leverage. 62.2% of retail investor accounts lose money when trading CFDs with this provider. Trading forex and CFDs may not be suitable for all investors. Consider your objectives, experience, and risk appetite before trading, and ensure you understand the risks involved. Broker Disclosure: PU Prime is a live, regulated multi-entity broker (not a simulated prop-firm evaluation) — trades are executed with real capital in live market conditions, subject to normal market risk. Which PU Prime entity holds your account depends on your country of residence and determines your leverage cap and protections.
Last verified: August 2026 | Editorial Team
Doji Candlestick: What It Signals and How to Trade It
A doji candlestick forms when a session's opening and closing prices are virtually identical, leaving little or no visible body between them. It records a session in which price moved up and down but ultimately returned to where it started — buyers and sellers cancelled each other out. That equilibrium is meaningful, but only in context. A doji is not a buy or sell signal on its own. Its directional implication depends on where it sits within a prior trend, which of its five variants you are looking at, and whether the next candle confirms a shift in control. Without those three inputs, the pattern is noise.
What the Doji Candle Actually Records
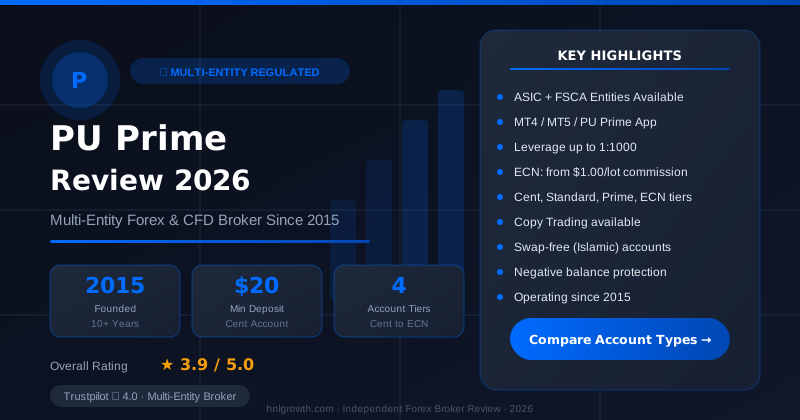
PU Prime — Multi-Entity Forex & CFD Broker
ASIC (AU) + FSCA (ZA) entities available · $20 min deposit (Cent) · MT4, MT5, PU Prime App · 4 account tiers
Every candlestick is a compressed price story: open, high, low, close. The body — the rectangle between open and close — shows where price settled relative to where it started. A wide body means one side dominated. A negligible or absent body means neither side did.
A doji forms when open and close are equal or close enough that the body disappears. The wicks above and below that body are what remain, and they are not decorative. Each wick is a record of rejected price territory.
Think of it this way. During the session, buyers pushed price upward. Sellers pushed back. The upper wick records how far up buyers got before sellers rejected that range and drove price back down. The lower wick records how far sellers pushed before buyers absorbed the pressure and lifted price back. When the session closes at roughly the same level it opened, those two forces have neutralised each other — hence the doji.
This wick-as-pressure-map framing turns visual recognition into causal understanding. A long upper wick does not just look dramatic; it tells you that sellers were active and willing to push price back from the highs. A long lower wick tells you that buyers stepped in and defended the lows. The geometry of the wicks is evidence of where supply and demand competed most intensely.
This is also how a doji differs from a spinning top. A spinning top has a small but visible body — one side slightly outperformed the other before the session closed. A doji has no meaningful body at all, meaning the contest was even more evenly matched. The directional implication differs: a spinning top can signal hesitation within a trend; a doji signals outright equilibrium.
Five Doji Formations and What Each Wick Pattern Signals
The five doji variants are distinguished entirely by wick geometry. Each tells a different story about session pressure, and each carries different directional weight depending on the prior trend.
| Formation | Wick geometry | What the wick pattern tells you | Signal strength after uptrend | Signal strength after downtrend | Reliability rank |
|---|---|---|---|---|---|
| Standard | Short roughly equal wicks above and below | Mild contestation; price moved little from open | Weak caution signal | Weak caution signal | 4 |
| Long-legged | Long roughly equal wicks above and below | Strong two-way pressure; both sides tried and failed | Moderate — sustained pressure on both sides | Moderate — sustained pressure on both sides | 3 |
| Gravestone | Long upper wick only; no meaningful lower wick | Buyers pushed price up sharply; sellers rejected the highs entirely and closed at or near the open/low | Strong bearish reversal signal | Low signal value | 1 (bearish context) |
| Dragonfly | Long lower wick only; no meaningful upper wick | Sellers pushed price down sharply; buyers absorbed all selling and recovered to near the open/high | Low signal value | Strong bullish reversal signal | 1 (bullish context) |
| Four-price | No wicks at all; open, high, low, and close are identical | No price movement; market effectively did not trade | Unreliable — thin or illiquid market | Unreliable — thin or illiquid market | 5 (lowest) |
A few points worth emphasising. The gravestone doji is the most structurally distinctive bearish signal in this family: its long upper wick records a full cycle of buyer ambition followed by complete seller rejection. The dragonfly mirrors this from the bullish side. The four-price doji is an artefact of illiquidity and carries no analytical weight in normal conditions.
Long-legged doji are visually striking and often appear during high-volatility sessions. They show that both sides were active and neither won — but that does not automatically mean reversal is coming. It may mean the market is digesting a large move and will continue in the same direction once the uncertainty resolves.
Why Context Changes Everything: Trend Position and Location
The same doji can carry opposing implications depending on where it appears. This is the single most important concept for avoiding misreads.
A gravestone doji appearing after a sustained uptrend carries genuine bearish reversal potential. Price has been rising. Buyers pushed it higher still during the session, sellers crushed that attempt, and the session closed near its open. The upper wick records rejected bullish pressure at an elevated price level. That combination — exhausted uptrend, failed push to new highs, strong seller presence — gives the pattern its weight.
The same gravestone doji appearing mid-range after a sideways session, or at the beginning of a downtrend that has already reversed, carries little directional signal. The market has no established momentum for the pattern to interrupt.
Similarly, a dragonfly doji at the bottom of a sustained downtrend carries bullish reversal potential: sellers drove price sharply lower, buyers absorbed that selling and recovered the session. But a dragonfly appearing mid-uptrend is likely just a consolidation candle with no reversal implication at all.
Location relative to key price levels adds a second modifier. A doji forming precisely at a known support or resistance level — a prior swing high, a round number, a moving average that has repeatedly held — carries more signal than the same pattern appearing in open space between levels. The price level adds external evidence that supply or demand has historically been concentrated at that zone.
The decision rule is straightforward: before interpreting any doji, identify (1) what the prior trend direction is and (2) whether the doji has formed at a structurally significant price level. If neither condition is clearly present, the pattern's implications are too weak to act on.
Confirmation Before You Act: A Prioritised Checklist
A doji is a hypothesis, not a verdict. It raises a question — has control shifted? — but does not answer it. Confirmation is the evidence you need before treating the question as answered.
Not all confirmation signals carry equal weight. The table below ranks them by reliability tier so that beginners have a prioritised protocol rather than an undifferentiated list.
| Priority tier | Signal type | What to look for | Why it strengthens the doji case | Minimum acceptable condition |
|---|---|---|---|---|
| Tier 1 — Confirming candle | Follow-on candle direction | The candle after the doji closes in the expected direction (bearish close after gravestone; bullish close after dragonfly) and has a visible body | Direct price evidence that control has shifted; the market has started to act on the equilibrium | The confirming candle must close, not just trade, in the expected direction |
| Tier 2 — Volume spike | Session volume on the doji itself | Volume on the doji candle is meaningfully above recent average | High volume on a doji means the equilibrium was contested at scale — a large number of participants reached stalemate, which makes the signal more structurally significant | Volume should be above the 20-session average; a modest uptick is insufficient |
| Tier 3 — RSI at extreme | RSI reading at the time of the doji | RSI above 70 (overbought) supports a gravestone bearish case; RSI below 30 (oversold) supports a dragonfly bullish case | Adds momentum evidence to the structural evidence; reduces the probability that the doji is mid-trend noise | RSI should be at or beyond the 70/30 threshold, not merely elevated |
| Tier 4 — Key level proximity | Doji position relative to support/resistance | Doji forms at or within a few pips of a previously tested support or resistance level | Confirms that the doji is appearing where supply or demand has historically been concentrated, not in structurally empty space | The level must be clearly defined from prior price history, not a recently drawn line |
Tier 1 is the minimum reasonable entry condition for most traders. Tiers 2 and 3 are strengthening signals that increase conviction but are not always simultaneously available. Tier 4 is a context enhancer, not a standalone signal. Having Tier 1 plus any one of Tiers 2–4 represents a materially stronger case than Tier 1 alone.
One context-dependent exception to note: during high-volatility macro events — central bank rate decisions, non-farm payroll releases, major geopolitical announcements — doji formations are more likely to be noise than structure. When price is being driven by a single external catalyst rather than organic supply and demand balance, the equilibrium interpretation does not hold. The two-sided pressure that a doji normally records is instead an artefact of chaotic order flow. Avoid treating event-session doji as technical signals regardless of how clean the geometry looks.
Worked Trade Example: From Doji Identification to Order Placement
The following is a hypothetical EUR/USD daily chart scenario constructed to illustrate the decision sequence. It uses no specific historical date and claims no tested outcome.
Scenario: EUR/USD has been in a gradual uptrend for several weeks. Price has climbed from 1.0800 to 1.1050. On a given daily session, a gravestone doji forms at 1.1050, right at a resistance level that rejected price in a prior swing high three months earlier.
Step 1 — Identify the doji type. Long upper wick, no lower wick, open and close near 1.1020. This is a gravestone doji.
Step 2 — Assess context. Prior trend: uptrend. Location: at a known resistance level (1.1050) that previously rejected price. Both context conditions are present. The pattern is worth watching.
Step 3 — Wait for confirmation. The following daily candle opens at 1.1018 and closes at 1.0985 — a bearish close with a visible body. Tier 1 confirmation is met. RSI has pulled back from 72, satisfying Tier 3. Tier 2 and Tier 4 were already present: the doji session volume was above the 20-day average, and the 1.1050 level is well-established.
Step 4 — Define entry. Entry on the close of the confirming candle, approximately 1.0985.
Step 5 — Place the stop-loss. For a gravestone doji bearish trade, the stop goes above the upper wick tip of the doji — the point at which sellers rejected price. If the wick high is 1.1070, stop is placed at 1.1075 (a few pips above the wick to account for spread and brief overextension). Stop distance from entry: approximately 90 pips.
Step 6 — Set the profit target. A logical first target is the next meaningful support level below entry, for example 1.0900, giving a target distance of approximately 85 pips. This produces a risk-reward ratio of roughly 1:0.94 — too tight to be worth taking. Extending the target to 1.0850 (135 pips from entry) produces approximately 1:1.5. A target at 1.0800 (185 pips) produces approximately 1:2, which is a more acceptable minimum for most traders.
Spread impact note: PU Prime offers multiple account types with different spread structures. Indicative spreads vary by account type — the Standard account is described on the PU Prime spreads and costs page as having spreads from 1.3 pips on EUR/USD, while Prime and ECN accounts offer tighter raw spreads with commission components. Spreads are variable and the official page notes that listed values are for reference only; check MT4/MT5 or the PU Prime app for current figures. For a stop-loss of 90 pips, a 1.3-pip spread adds roughly 1.4% to the cost of the entry, which has a modest but real effect on the achieved risk-reward ratio. Tighter spread accounts improve this margin for frequent doji traders.
The stop-loss placement guide summarised:
| Doji type | Signal direction | Stop-loss level | Logic | What invalidates the thesis |
|---|---|---|---|---|
| Gravestone | Bearish | Above upper wick tip | Sellers rejected prices above this level; a close above it means buyers have re-taken control | Price closes above the wick high |
| Dragonfly | Bullish | Below lower wick tip | Buyers defended prices below this level; a breach means sellers have reasserted | Price closes below the wick low |
| Long-legged | Either direction (confirm first) | Above upper wick (bearish) / below lower wick (bullish) | Both extremes were tested; the invalidating move re-tests and breaks the relevant extreme | Break and close beyond the relevant wick extreme |
| Standard | Context-dependent | Above recent high (bearish) / below recent low (bullish) | Wicks are short; stop uses the broader recent range rather than the doji wick alone | Break of the surrounding consolidation range |
Disclosure: This page may contain affiliate links. We may earn a commission if you open an account through our links, at no extra cost to you.
If you want to practise this decision sequence on live market data without committing capital, PU Prime's demo account replicates real market conditions on the same MT4/MT5 platforms used for live trading. Open a PU Prime demo account and work through the identification and order placement steps on actual EUR/USD charts.
When Doji Signals Break Down: Limitations and False Signal Conditions
Doji patterns produce false signals in identifiable conditions. Understanding those conditions is more useful than a general caveat about reliability.
Sub-daily timeframes. On 1-minute, 5-minute, and 15-minute charts, doji formations are frequent and mostly meaningless. Spread effects become proportionally larger relative to the candle's range, and random intraday noise generates near-equal open and close prices routinely. A doji on a 5-minute EUR/USD chart during a quiet Asian session carries virtually no analytical weight. Daily and weekly doji near key levels carry materially higher signal-to-noise ratios. This is the most consistent degradation pattern across the doji family.
Mid-range appearances. A doji appearing in the middle of a trading range — between established support and resistance — lacks the trend context that gives the pattern its directional implication. It simply means price is oscillating, as range-bound markets do. Acting on mid-range doji is a common beginner error.
Low-liquidity instruments. Thinly traded instruments — certain small-cap shares, exotic currency pairs, off-hours sessions — produce doji formations simply because few transactions occurred. The four-price doji is the extreme example, but partial four-price characteristics appear in any illiquid condition. These are artefacts of market structure, not supply/demand equilibrium.
Absent confirmation. Entering immediately on the doji candle itself, without waiting for the confirming follow-on candle, is the most consistent mistake across traders who report being stopped out frequently on this pattern. The doji identifies a moment of equilibrium; it does not tell you which side will next take control. Acting before that question is answered is the error, not the pattern itself.
Quantitative reliability. No verified quantitative data on doji reversal success rates across timeframes or asset classes is included here, because no primary research or cited academic study was available to support specific figures. Claims such as "doji precedes reversal X% of the time" circulate widely but are not grounded in methodology-disclosed research. The honest framing is that doji patterns, used with context and confirmation, offer a structured hypothesis worth testing — they do not offer a statistical edge that can be quoted with confidence from secondary sources alone.
Practising Doji Recognition Without Capital at Risk
Reading about doji patterns builds a mental model. Recognising them in real-time market data, under the pressure of live prices, is a different skill that develops only through repetition.
A demo account is the logical bridge between theory and live trading. PU Prime's demo environment uses real market prices on MT4 and MT5, the same platforms used for live accounts. You can place orders, practise the stop-loss placement logic from the worked example above, and test the confirmation sequence across multiple chart sessions without any capital at risk. According to the official account opening page, the demo account is available to use while your live account verification is in progress — which means you can start building pattern recognition skills immediately.
Open a PU Prime demo account and practise doji identification on live charts
The official how-to-open page covers the full account setup process including document requirements and account type differences.
Frequently Asked Questions
Is a doji candlestick bullish or bearish? Neither inherently. The same formation can support a bearish interpretation (gravestone doji after an uptrend) or a bullish interpretation (dragonfly doji after a downtrend). The direction depends on the prior trend and confirmation, not the candle itself. Anyone who says a specific doji type is always bullish or always bearish is omitting the context that makes the distinction meaningful.
What is the difference between a doji and a spinning top? A spinning top has a small but visible body — one side marginally outperformed the other before the session closed. A doji has no meaningful body at all, indicating more precise equilibrium between buyers and sellers. Both signal indecision, but a doji is the more extreme form of it. For trading purposes, the difference in body size suggests the doji represents more evenly matched pressure, which some traders weight more heavily as a potential turning point signal.
Do doji patterns work on all timeframes? The reliability of doji signals degrades significantly on sub-daily charts (15-minute, 5-minute, 1-minute) due to noise and spread effects. Daily and weekly doji near established support or resistance levels carry the highest signal-to-noise ratio. If you are trading shorter timeframes, apply higher confirmation thresholds or avoid the pattern entirely until you can test its behaviour systematically.
How reliable are doji patterns for predicting reversals? Conditionally useful, not reliably predictive. Doji patterns are most accurately described as alerts to slow down and look for confirmation rather than standalone reversal forecasts. The conditions that raise their reliability — strong prior trend, key level proximity, confirming candle, above-average volume — are not always simultaneously present. When they are, the pattern offers a structured hypothesis worth acting on with defined risk. When they are not, it is better treated as noise.
Where exactly should I place my stop-loss on a doji trade? For a bearish gravestone doji signal, the stop goes above the upper wick tip. For a bullish dragonfly signal, the stop goes below the lower wick tip. The logic is that a price close beyond those extremes invalidates the equilibrium thesis — buyers or sellers have demonstrably re-taken the territory the doji's wick said was rejected. Do not place stops tighter than the full wick distance; this is the most common mechanical reason for premature stop-outs on otherwise valid setups.
About PU Prime's Regulatory Status
PU Prime is regulated by multiple financial authorities. According to the official regulation page, these include the Financial Services Authority of Seychelles (FSA), the Financial Services Commission of Mauritius (FSC), the Financial Sector Conduct Authority of South Africa (FSCA), and the Capital Market Authority of the UAE (CMA). PU Prime operates through multiple entities, and the regulatory protections, terms, and conditions applicable to any individual client depend on the specific entity they are onboarded to and the jurisdiction in which they reside. Not all regulatory frameworks apply universally — review the entity-specific terms and confirm which entity's oversight applies in your jurisdiction before trading.
Risk warning: CFDs and leveraged forex products are complex instruments and carry a high risk of losing money rapidly due to leverage. Consider whether you understand how these products work and whether you can afford to take the high risk of losing your capital. Check the entity, terms and protections that apply in your jurisdiction before trading.
Ready to Compare PU Prime Account Types?
PU Prime is a multi-entity broker — ASIC (Australia) and FSCA (South Africa) regulated entities offer stronger oversight, while most international clients are onboarded to the FSA Seychelles or FSC Mauritius entities. Four account tiers (Cent, Standard, Prime, ECN) range from a $20 minimum deposit to full ECN pricing.
Risk disclaimer: PU Prime is a live, regulated multi-entity broker — trading forex and CFDs is done with real capital under normal market risk (this is not a simulated prop-firm evaluation). PU Prime operates under multiple separate licenses (ASIC, FSCA, FSA Seychelles, FSC Mauritius); which entity holds your account depends on your country of residence and determines your leverage cap and protections — confirm this before funding. CFDs and leveraged forex products are complex instruments and carry a high risk of losing money rapidly due to leverage; 62.2% of retail investor accounts lose money when trading CFDs with this provider. Consider whether you understand how CFDs/forex work and whether you can afford the high risk of losing your money. Affiliate disclosure: HNL Growth earns a commission when you open a PU Prime account through links on this page.