Fibonacci Retracement Levels: A Practical Guide
Affiliate disclosure: This page may contain affiliate links. We may earn a commission if you open an account through our links, at no extra cost to you.
Reviewed using our forex & CFD broker review methodology
Checked on: 2026-08-17 | Broker terms, regulation, and pricing can change. Always verify at the official PU Prime site before opening an account.
Affiliate Disclosure: HNL Growth may earn a commission if you open an account through our links, at no additional cost to you. Risk Warning: CFDs and leveraged forex products are complex instruments and carry a high risk of losing money rapidly due to leverage. 62.2% of retail investor accounts lose money when trading CFDs with this provider. Trading forex and CFDs may not be suitable for all investors. Consider your objectives, experience, and risk appetite before trading, and ensure you understand the risks involved. Broker Disclosure: PU Prime is a live, regulated multi-entity broker (not a simulated prop-firm evaluation) — trades are executed with real capital in live market conditions, subject to normal market risk. Which PU Prime entity holds your account depends on your country of residence and determines your leverage cap and protections.
Last verified: August 2026 | Editorial Team
Fibonacci Retracement Levels: A Practical Guide
Affiliate disclosure: This page may contain affiliate links. We may earn a commission if you open an account through our links, at no extra cost to you.
Risk notice: CFDs and leveraged forex products are complex instruments and carry a high risk of losing money rapidly due to leverage. Consider whether you understand how these products work and whether you can afford to take the high risk of losing your capital. Check the entity, terms and protections that apply in your jurisdiction before trading.
Fibonacci retracement is a charting tool that uses a set of ratios — mainly 23.6%, 38.2%, 50%, 61.8% and 78.6% — to mark price zones where a pullback within a trend might pause or reverse. Traders draw it between a recent swing high and swing low to highlight areas worth watching for a possible bounce, entry, or stop placement. It is a visual aid, not a forecasting tool — it does not tell you what price will do, only where other traders are commonly looking. Used alongside trend context and a confirmation signal, it can help structure a trade plan. Used alone, it offers no proven edge.
What Fibonacci retracement is, in plain terms
PU Prime — Multi-Entity Forex & CFD Broker
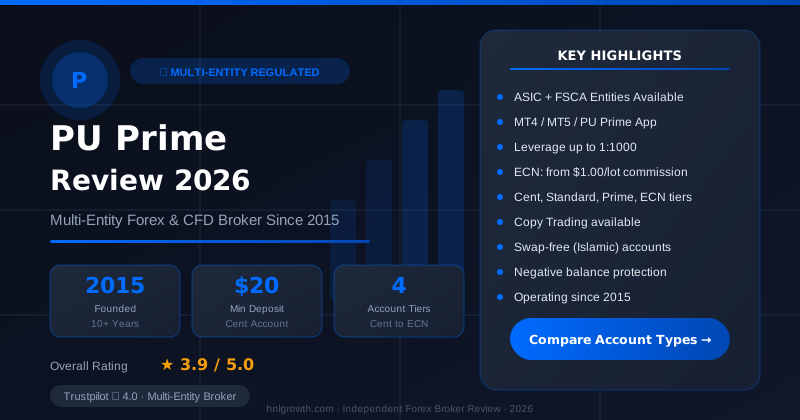
ASIC (AU) + FSCA (ZA) entities available · $20 min deposit (Cent) · MT4, MT5, PU Prime App · 4 account tiers
When a market moves strongly in one direction, it rarely goes there in a straight line. It pushes higher (or lower), then pulls back a bit, then continues. Fibonacci retracement is a way of estimating how far that pullback might go before the original trend potentially resumes.
To use it, you pick two points: the start of a price swing and the end of it. The charting tool then divides the vertical distance between those two points into horizontal lines at fixed percentages — 23.6%, 38.2%, 50%, 61.8% and 78.6% of the total move.
A quick clarification worth knowing early: 50% is not actually derived from the Fibonacci sequence. It became a standard level because markets have historically shown a tendency to retrace around half of a prior move, and traders kept using it alongside the true Fibonacci ratios until it became convention. The 23.6%, 38.2%, 61.8% and 78.6% levels do come from Fibonacci-based division patterns.
In practice, traders treat 38.2% and 61.8% as the two levels watched most closely, with 23.6% seen as a shallow pullback and 78.6% as a deep one that borders on a full trend reversal rather than a pause.
None of these levels are support or resistance in the way a prior swing high or a round number might be. They are probability zones based on a mathematical pattern, not price levels the market is contractually obliged to respect.
Where the levels come from
The ratios trace back to the Fibonacci sequence, a series of numbers where each one is the sum of the two before it (0, 1, 1, 2, 3, 5, 8, 13, 21, 34, 55, and so on). Dividing numbers in this sequence by the one that follows a few places later consistently produces ratios close to 0.236, 0.382, 0.618 and their variations. The 0.618 figure is also known as the golden ratio, a proportion that appears in unrelated natural and mathematical contexts, which is part of why it attracted traders' attention decades ago.
That background is interesting, but it does not prove the ratios have predictive power in financial markets. The more practical explanation for why they matter today is adoption: the levels are built into virtually every charting platform, a large number of traders plot the same lines on the same charts, and when enough people watch the same zone and act around it, that collective attention can itself influence short-term price behaviour. This is usually described as a self-fulfilling pattern. Understanding it as trader psychology is more useful than dismissing it as a flaw — it is one of the more honest explanations for why the tool has stayed popular.
Platform note: drawing the tool
Fibonacci retracement drawing tools are available on both MetaTrader 4 (MT4) and MetaTrader 5 (MT5). On either platform, the tool is typically found in the Insert menu or the drawing toolbar. You select it, click the swing low, and drag to the swing high (or vice versa for a downtrend) — the levels are then plotted automatically. If you are unsure which platform to use, MT5 is the newer version and offers additional analytical features. PU Prime supports both; you can check current spreads and instrument availability across account types to confirm which markets you plan to practise on.
How it works, with a worked example
The mechanical process is the same regardless of the market or timeframe:
- Identify a clear trend. Fibonacci retracement is built around measuring a pullback within a directional move, so you need a visible swing up or down first.
- Select the swing high and swing low. In an uptrend, draw from the low to the high. In a downtrend, draw from the high to the low.
- Plot the retracement levels. The tool automatically marks the key percentages between those two points.
- Wait for price to approach a level and look for confirmation. This might be a candlestick pattern, a bounce off a moving average, or a shift in momentum — something independent of the Fibonacci line itself.
- Only then consider your entry, stop-loss and target, based on the structure of the move, not on the Fibonacci level alone.
An illustrative example
The following example uses entirely invented price levels to show the logic of the approach. It does not represent a real historical move, a signal, or a recommendation for any instrument.
Say a currency pair rallies from 1.0500 to 1.0850, then starts to pull back. A trader drawing a Fibonacci retracement between those two points would get levels approximately as follows:
| Level | Approx. price (illustrative only) | What traders typically watch for |
|---|---|---|
| 23.6% | 1.0767 | A shallow pullback, often seen in strong trends |
| 38.2% | 1.0716 | A common first area to watch for a pause |
| 50.0% | 1.0675 | A widely watched midpoint — not a true Fibonacci ratio |
| 61.8% | 1.0634 | Often treated as the key zone before a deeper pullback |
| 78.6% | 1.0575 | A deep retracement, closer to a possible trend change |
If price pulled back toward the 61.8% level and then formed a bullish reversal candle, a trader might look for a long entry with a stop-loss placed just below the 78.6% level to allow room for normal volatility, and an initial target near the prior high. The stop and target placement matter more than the Fibonacci line itself — the level only flags a zone of interest, and your risk management decides whether the trade is worth taking at all.
Account type suitability: a brief note for broker-switchers
If you are evaluating whether to practise this technique on a live account, the account type you choose affects both cost structure and appropriate risk exposure. CFD accounts — which is how forex and most other instruments are traded at retail brokers — involve leverage, meaning losses can exceed your initial deposit. Share dealing, where available, carries different risk characteristics. Before funding any account, review the leverage terms, margin requirements, and any commissions applicable to the instruments you plan to trade. PU Prime publishes indicative spreads and costs by account type (note that live values should be verified on the platform, as stated on that page). A demo account is the appropriate starting point before committing capital to any new technique.
How to practise Fibonacci retracement on a demo account
Because Fibonacci retracement depends on judgment — picking the right swing points, reading confirmation signals, and managing a trade once it is open — it is a tool that benefits from repetition before any real money is involved. Practising on a demo account lets you draw the levels on live price feeds, observe how price behaves around them across different instruments and timeframes, and develop a feel for how often a level holds versus gets broken, without risking capital while you learn.
If you want to test this approach before applying it live, you can open a PU Prime account and start on a demo to practise plotting retracement levels using real market prices. According to PU Prime's account opening guide, registration takes around 10–15 minutes, the Standard account requires a $50 minimum deposit, and a Cent account is available from $20 — though a demo requires no initial funding.
A sensible practice routine: pick one instrument you already follow, mark a handful of recent swings on the chart, note where price reacted to each level, and keep a simple log of what happened versus what you expected. Do this over several weeks before deciding whether the tool earns a place in your live trading process.
Regulation and jurisdiction: what to check before funding
Before opening any live account, confirming which regulatory entity covers your jurisdiction is a necessary step, not a formality. PU Prime states on its regulation page that it operates under the oversight of several financial authorities and that full regulatory details are available on its website. The same page includes a jurisdiction acknowledgement notice confirming that access, protections, and applicable entity may differ depending on where you reside. Check the specific licence, compensation scheme (if any), and segregated-funds policy that apply to your country before depositing, as these vary between entities and jurisdictions.
The main risks and who this tool is not for
Fibonacci retracement is suggestive, not confirmatory. It highlights a zone where a reaction is plausible, but there is no guarantee that price will pause, bounce, or reverse there. There is no independent, verifiable data showing that trading purely off Fibonacci levels improves profitability, and the tool should not be treated as a standalone signal.
The tool tends to be less useful, or actively misleading, in certain situations:
- Choppy or range-bound markets with no clear swing. Without a defined trend leg, there is no reliable high or low to anchor the levels, so the retracement becomes arbitrary.
- Very short timeframes traded without confirmation. Noise increases as the timeframe shortens, and a level that looks meaningful on a 1-minute chart can be irrelevant moments later.
- Traders who want certainty before entering a position. If the appeal is a tool that removes ambiguity, Fibonacci will disappoint — it narrows down where to look, not what will happen.
- News-driven or highly volatile conditions. A sharp move driven by an economic release or unexpected headline can pass straight through every retracement level without pausing, because the price action is being driven by new information rather than the technical structure of the prior swing.
A normal, expected outcome of using this tool is that price sometimes breaks straight through a level without reacting at all. That is not a failure of the method — it is a reminder that the tool describes a probability zone, not a floor or ceiling, and that a stop-loss on every trade is what actually protects you when a level fails to hold.
Common mistakes beginners make with Fibonacci levels
- Picking the wrong swing points. Anchoring the retracement to a minor, insignificant high or low instead of the actual start and end of the dominant move produces levels that do not reflect anything meaningful.
- Treating a level as a guaranteed reversal. Price approaching 61.8% is a reason to pay attention, not a reason to enter a trade automatically.
- Ignoring the broader trend. Drawing retracements in isolation, without checking whether the higher-timeframe trend supports the trade direction, increases the odds of fighting the dominant move.
- Skipping confirmation entirely. Entering the moment price touches a line, rather than waiting for a candlestick signal, a momentum shift, or another independent cue, removes the one practical input that gives the level any trading value.
- No stop-loss discipline. Because Fibonacci levels can and do fail, every trade based on them needs a predefined exit if the level does not hold. Skipping this step turns a manageable pullback into an open-ended loss.
- Overloading the chart. Plotting Fibonacci retracements alongside multiple moving averages and several oscillators at once can produce so much visual noise that no single signal stands out clearly.
Quick decision checklist
| Good conditions to try Fibonacci | Consider skipping it for now |
|---|---|
| A clear, visible trend with a defined swing high and low | Sideways, range-bound price action with no dominant direction |
| A timeframe you already trade with some consistency | Very short timeframes with no plan for confirmation |
| At least one other signal available for confirmation (candlestick pattern, moving average, momentum indicator) | Trading purely off the Fibonacci line with no other input |
| A predefined stop-loss and position size before entering | No risk management plan in place |
| You have confirmed the account type and leverage terms applicable to your chosen instrument | You have not reviewed which entity and jurisdiction protections apply to your account |
FAQ
Which Fibonacci levels matter most? Most traders treat 38.2% and 61.8% as the primary levels to watch, with 23.6% representing a shallow pullback and 78.6% a deep one that borders on a trend change. The 50% level is widely used too, even though it is not a true Fibonacci ratio.
Can Fibonacci retracement predict reversals? No. It marks zones where a reaction is plausible based on historical tendency and widespread use, not a level that guarantees a reversal. Price frequently passes straight through these zones, particularly during strong trends or news-driven moves.
Does Fibonacci retracement work on all markets? The mechanics apply the same way to forex, indices, commodities, shares and other charted instruments, since it is purely a function of price and swing structure. How reliably price reacts to the levels varies by instrument, timeframe and market conditions. There is no independent data confirming it performs consistently better in one asset class than another.
Does using Fibonacci retracement actually improve profitability? No independent, verifiable backtesting or academic research is cited here that confirms this. It is best treated as one input for identifying areas of interest, used together with a confirmation signal and a clear risk management plan, rather than a technique with a demonstrated return on its own.
Do MT4 and MT5 both support Fibonacci drawing tools? Yes. Both MetaTrader 4 and MetaTrader 5 include Fibonacci retracement drawing tools as standard features. The tool is applied by selecting it from the Insert menu or drawing toolbar, then clicking and dragging between your chosen swing points. PU Prime supports both platforms; refer to the account opening guide for platform selection guidance.
What indicators do traders commonly pair with Fibonacci levels? Moving averages, momentum indicators such as MACD or RSI, and candlestick confirmation patterns are commonly used alongside Fibonacci retracement in general trading practice. This reflects common educational usage, not a performance guarantee.
What is the difference between retracement and extension levels? Retracement levels (23.6% to 78.6%) estimate how far a pullback within an existing move might go. Extension levels (such as 161.8%) project potential targets beyond the original swing, typically once the retracement has completed and the trend resumes. Extensions are a separate, more advanced application and are not covered in a beginner-level retracement guide.
Risk warning
Risk warning: CFDs and leveraged forex products are complex instruments and carry a high risk of losing money rapidly due to leverage. Consider whether you understand how these products work and whether you can afford to take the high risk of losing your capital. Check the entity, terms and protections that apply in your jurisdiction before trading. Fibonacci retracement and any other technical analysis tool are educational aids for identifying areas of interest on a chart. They do not eliminate the underlying risks of leveraged trading, and past patterns in price behaviour are not a reliable indicator of future results.
Ready to Compare PU Prime Account Types?
PU Prime is a multi-entity broker — ASIC (Australia) and FSCA (South Africa) regulated entities offer stronger oversight, while most international clients are onboarded to the FSA Seychelles or FSC Mauritius entities. Four account tiers (Cent, Standard, Prime, ECN) range from a $20 minimum deposit to full ECN pricing.
Risk disclaimer: PU Prime is a live, regulated multi-entity broker — trading forex and CFDs is done with real capital under normal market risk (this is not a simulated prop-firm evaluation). PU Prime operates under multiple separate licenses (ASIC, FSCA, FSA Seychelles, FSC Mauritius); which entity holds your account depends on your country of residence and determines your leverage cap and protections — confirm this before funding. CFDs and leveraged forex products are complex instruments and carry a high risk of losing money rapidly due to leverage; 62.2% of retail investor accounts lose money when trading CFDs with this provider. Consider whether you understand how CFDs/forex work and whether you can afford the high risk of losing your money. Affiliate disclosure: HNL Growth earns a commission when you open a PU Prime account through links on this page.