Forex Risk Calculator: Position Size From Your Risk Percentage
A forex risk calculator converts three inputs — account balance, chosen risk percentage, and stop-loss distance in pips — into a precise lot size and monetary risk figure before...
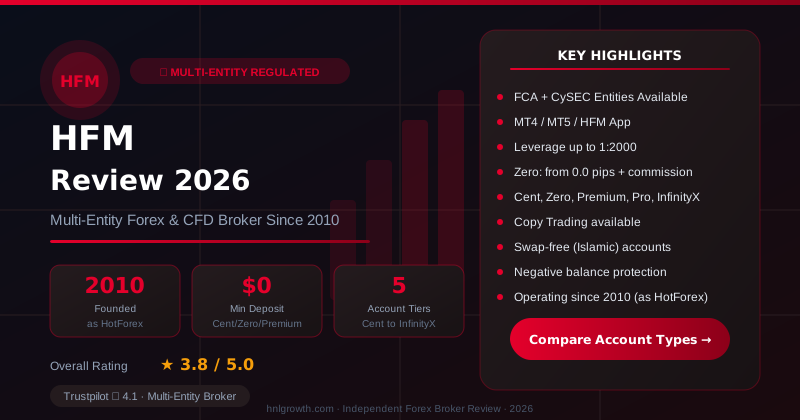
Checked on: 2026-08-10 | Broker terms, regulation, and pricing can change. Always verify at the official HFM site before opening an account.
Affiliate Disclosure: HNL Growth may earn a commission if you open an account through our links, at no additional cost to you. Risk Warning: CFDs and leveraged forex products are complex instruments and carry a high risk of losing money rapidly due to leverage. Between 65-95% of retail investor accounts lose money when trading CFDs, depending on the HFM entity and account type. Trading forex and CFDs may not be suitable for all investors. Consider your objectives, experience, and risk appetite before trading, and ensure you understand the risks involved. Broker Disclosure: HFM (HF Markets Group) is a live, regulated multi-entity broker (not a simulated prop-firm evaluation) — trades are executed with real capital in live market conditions, subject to normal market risk. Protections vary significantly by the specific legal entity that onboards your account.
Forex Risk Calculator: Calculate Position Size From Your Risk Percentage
A forex risk calculator converts three inputs — account balance, chosen risk percentage, and stop-loss distance in pips — into a precise lot size and monetary risk figure before you place a trade. Instead of guessing position size or using a fixed lot for every setup, the tool anchors each trade to a defined capital-at-risk amount, so a losing streak of five or ten trades stays within a survivable drawdown rather than threatening the account. The calculator below applies the standard position-sizing formula used across institutional and retail desks, and every output is reproducible with the worked formula further down the page.
Position Size Calculator
HashHedge — Crypto Futures Prop Firm
Up to $200K funded accounts · 85% profit split · Instant USDT payouts · 160+ assets
Inputs
- Account balance (e.g., $5,000)
- Risk per trade (%) — typically 0.5% to 2%
- Stop-loss distance (pips)
- Currency pair (e.g., EUR/USD, GBP/USD, USD/JPY)
- Account currency (USD, EUR, GBP, etc.)
- Leverage (e.g., 1:100, 1:200, 1:400)
Outputs
- Lot size (in standard lots, rounded to the account's minimum increment)
- Monetary risk (the exact amount lost if the stop is hit)
- Margin used (capital locked to open the position)
- Pip value (profit/loss per pip at the calculated lot size)
This page provides the calculation methodology and a transparent formula. Apply the numbers above on your own platform's order ticket, or use the built-in calculators available inside MetaTrader 4, MetaTrader 5, and the HFM app.
Disclosure: This page may contain affiliate links. We may earn a commission if you open an account through our links, at no extra cost to you.
Open a free HFM demo account to test position sizing with live market conditions
Reading Your Results: Lot Size, Monetary Risk, and Margin
The three outputs answer different questions:
- Lot size tells you what to enter on the order ticket. It is the position volume that makes your stop-loss distance equal the monetary risk you chose.
- Monetary risk is the cash amount you lose if price reaches your stop. It equals
balance × risk %and is the number that matters for drawdown management. - Margin used is the collateral your broker locks to keep the position open. It is not the amount at stake — a common confusion addressed in detail below.
Example result box Balance $5,000 · Risk 1% · Stop 30 pips · EUR/USD · Leverage 1:100 → Lot size 0.17 · Monetary risk $50 · Margin used $170 · Pip value $1.70
The Position-Sizing Formula, Step by Step
The formula has three stages: define monetary risk, calculate pip value per lot, then divide.
Step 1 — Monetary risk
Risk amount = Account balance × Risk %
Step 2 — Pip value per standard lot For pairs where USD is the quote currency (EUR/USD, GBP/USD, AUD/USD, NZD/USD):
Pip value (1 standard lot) = $10
For pairs where USD is the base currency (USD/JPY, USD/CHF, USD/CAD):
Pip value = $10 / current exchange rate
For cross pairs, convert the quote-currency pip value into your account currency at the prevailing rate.
Step 3 — Lot size
Lot size = Risk amount / (Stop-loss pips × Pip value per lot)
Worked example: $5,000 account, 1% risk, 30-pip stop, EUR/USD
- Risk amount = $5,000 × 0.01 = $50
- EUR/USD pip value per standard lot = $10
- Lot size = $50 / (30 × $10) = $50 / $300 = 0.1667 lots
- Rounded to the minimum increment of 0.01 (the smallest trade size on HFM's Premium Pro account per the official trading accounts page): 0.17 lots
- Margin at 1:100 leverage = 0.17 × 100,000 EUR / 100 ≈ $170 (converted at the EUR/USD rate)
Lot-size scenario table
| Balance | Risk % | Risk $ | 30-pip stop → Lot size |
|---|---|---|---|
| $1,000 | 1% | $10 | 0.03 |
| $1,000 | 2% | $20 | 0.07 |
| $5,000 | 0.5% | $25 | 0.08 |
| $5,000 | 1% | $50 | 0.17 |
| $5,000 | 2% | $100 | 0.33 |
| $10,000 | 1% | $100 | 0.33 |
| $10,000 | 2% | $200 | 0.67 |
All figures assume EUR/USD, where pip value per standard lot = $10.
Pip-value reference by pair (USD account)
| Pair | Pip value per standard lot |
|---|---|
| EUR/USD, GBP/USD, AUD/USD, NZD/USD | $10.00 |
| USD/JPY (at 150.00) | $6.67 |
| USD/CHF (at 0.90) | $11.11 |
| USD/CAD (at 1.35) | $7.41 |
| EUR/GBP | $12.50 (converted) |
USD/JPY, USD/CHF, and USD/CAD values shift with the exchange rate — recalculate at entry.
How Much to Risk on a Single Trade
The 1–2% risk-per-trade guideline is a convention drawn from portfolio theory and widely taught in trading education. It is not a regulatory requirement. The logic is arithmetic: at 1% risk, a trader must lose 100 consecutive trades to wipe the account; at 5%, only 20.
Strategy-specific ranges
| Strategy | Typical trades/day | Risk per trade | Rationale |
|---|---|---|---|
| Scalping | 10–50 | 0.25%–0.75% | High frequency means daily risk accumulates quickly |
| Day trading | 2–6 | 0.5%–1.5% | Balanced frequency and conviction |
| Swing trading | 1–5 per week | 1%–2% | Fewer, higher-conviction setups |
| Position trading | 1–4 per month | 1%–2.5% | Wide stops require smaller per-pip exposure |
Linking risk to risk-reward ratio
Risk per trade does not operate in isolation. A strategy with a 1:3 average risk-reward and a 35% win rate is profitable in expectation, while a 1:1 strategy needs above 50%. Traders running high-R:R systems can often sustain the upper end of their risk band because losing streaks are expected; scalpers running 1:1 or worse need tighter per-trade risk to survive normal variance.
Leverage, Margin, and What You Actually Stand to Lose
Margin requirement versus risk at stake
These two numbers answer different questions and should never be treated as interchangeable:
- Margin is the deposit your broker holds while the position is open. It is returned when you close the trade (minus any profit or loss).
- Risk at stake is the loss you incur if your stop is hit. It is defined by your stop distance and lot size, not by your leverage.
A 0.17-lot EUR/USD position with a 30-pip stop risks $50 whether it is margined at 1:50 or 1:500. Higher leverage lets you open the same position with less locked capital — freeing equity for other trades — but it does not change the dollar amount lost when the stop triggers.
How leverage magnifies per-pip movement symmetrically
Leverage changes exposure per dollar of margin, not per lot. At 1:100, $170 of margin controls 0.17 lots; at 1:400 (the maximum available to Professional clients on HFM's Premium Pro account, per the official account specifications), $42.50 controls the same position. The pip value ($1.70) and the monetary risk ($50) are identical in both cases.
Margin-call buffer
HFM's Premium Pro account sets margin call at 50% and stop-out at 20%, according to the published trading accounts page. To calculate your buffer:
Free margin = Equity − Used margin
Margin level = (Equity / Used margin) × 100
A healthy buffer keeps margin level well above 200% after accounting for floating loss at the stop.
Spread-Adjusted Risk: Why Most Calculators Underestimate Your Stop
The stop-loss distance a trader reads off a chart is the distance from entry price to stop price. But a buy order fills at the ask and a sell stop triggers at the bid, so the effective distance on a long trade equals technical stop pips + spread. On a short trade the same widening applies in the opposite direction.
Spread-impact analysis (EUR/USD, indicative 1-pip spread)
| Technical stop | Effective stop (incl. 1-pip spread) | Lot-size reduction |
|---|---|---|
| 10 pips | 11 pips | −9.1% |
| 20 pips | 21 pips | −4.8% |
| 30 pips | 31 pips | −3.2% |
| 50 pips | 51 pips | −2.0% |
| 100 pips | 101 pips | −1.0% |
The tighter your stop, the more the spread distorts your intended risk. Scalpers running 5–10 pip stops face a 10–20% mispricing of risk if spread is ignored — often the difference between a correctly sized position and one that exceeds the per-trade limit.
For HFM's current indicative spreads by account type, check the broker's published trading conditions before applying the formula, as spreads are variable and widen during news releases and rollover.
Account Types and Lot-Size Tiers
Position sizing is constrained by the smallest lot your account allows. A $500 account risking 1% ($5) on a 20-pip EUR/USD stop needs 0.025 lots — impossible on an account with a 0.01 minimum increment, and uncomfortably close to it even when rounding is allowed.
HFM's Premium Pro account, the tier with published specifications on the broker's trading accounts page, offers:
- Contract size: 1 lot = 100,000 units
- Minimum trade size: 0.01 lots
- Trade size increment: 0.01
- Maximum position: 60 standard lots
- Variable spreads from 1 pip
- Leverage up to 1:400 for Professional clients
- Minimum deposit: $5,000 for Professional clients
HFM also markets Standard and Cent-style accounts in some jurisdictions, where minimum lot sizes and contract specifications differ. Cent accounts in particular divide a standard lot into smaller units, making sub-$5 risk amounts achievable on very small deposits. Because specifications vary by regulatory entity — HF Markets operates under FSA Seychelles, DFSA Dubai, CySEC in the EU, and other entities — confirm the exact contract specifications for your account before relying on any single table. The broker's legal and regulatory disclosures on its homepage indicate which entity applies to you.
Who each tier typically fits
| Account style | Best for | Watch out for |
|---|---|---|
| Cent / micro-lot | Small balances, new traders testing risk discipline | Wider spreads can offset granularity gains |
| Standard (0.01 min) | Balances above ~$1,000 using 1% risk | Sub-$10 risk amounts may fall below minimum lot |
| Premium Pro | Experienced traders with larger capital and Professional status | $5,000 minimum deposit for Professional clients |
Managing Risk Across Multiple Open Positions
Per-trade risk is only half the equation. A trader risking 2% on five uncorrelated setups risks roughly 10% of the account across the portfolio — but if those five trades are long EUR/USD, long GBP/USD, long AUD/USD, short USD/CHF, and short USD/JPY, all five are effectively short-US-dollar bets. A single USD-driven reversal can stop out most or all of them simultaneously.
A weekly risk budget framework
- Set a weekly maximum loss (e.g., 5% of starting-week equity).
- Allocate it across planned setups (e.g., five trades at 1% each).
- Stop trading for the week when the budget is consumed — regardless of conviction on the next setup.
Risk-of-ruin probability (simplified)
Risk of ruin estimates the probability that an account will fall to a specified fraction of its starting value over a long series of trades. The simplified formula for a fixed-percentage model with constant win rate W, average win R times the loss, and risk r per trade, targeting total loss:
P(ruin) ≈ ((1 − edge) / (1 + edge))^(units)
where edge = W × R − (1 − W), and units = −ln(target fraction) / r (approximate)
| Win rate | Avg R:R | Risk/trade | Approx. ruin probability (to 50% drawdown) |
|---|---|---|---|
| 40% | 1:2 | 1% | Low (single-digit %) |
| 40% | 1:2 | 3% | Moderate |
| 40% | 1:2 | 5% | High |
| 50% | 1:1.5 | 2% | Low–moderate |
| 30% | 1:3 | 2% | Moderate |
Exact values depend on the chosen formula and simulation parameters. The directional message is robust: higher per-trade risk and lower win rates compound into materially worse survival odds, even when expectancy is positive.
Common Position-Sizing Mistakes
- Ignoring spread in stop distance. A 10-pip stop with a 2-pip spread is an 8-pip technical stop and a 12-pip effective stop. Calculate risk on the 12-pip figure.
- Inconsistent risk percentages. Using 1% on most trades but 5% on "high conviction" ideas destroys the statistical protection the system is designed to provide.
- Confusing margin with risk. Seeing $42 margin on a 1:400 position and treating that as the amount at stake — when the stop may only risk $15, or the position may run a $500 floating loss before any stop triggers.
- Over-leveraging on conviction. Leverage is a funding mechanism, not a signal-quality indicator. Size the position from the stop distance, not from how sure you feel.
- Forgetting account-currency conversion. A EUR-denominated account trading GBP/JPY needs two conversions (JPY pip value → GBP → EUR) before the lot size is correct.
Position-Sizing Methods Compared
| Method | Core rule | Complexity | Risk consistency | Best for | Drawback |
|---|---|---|---|---|---|
| Fixed fractional | Risk a constant % of current equity | Low | High | Most retail traders | Account growth compounds slowly during drawdowns |
| Fixed ratio | Increase lot size only after defined profit units | Medium | Medium | Traders wanting asymmetric scaling | Parameters are arbitrary and backtest-sensitive |
| Kelly criterion | Bet the mathematically optimal % based on edge and payoff | High | Variable | Quantitative traders with measured edge | Full Kelly is extremely volatile; practitioners typically use half- or quarter-Kelly |
For traders still building a verified edge, fixed fractional is the most forgiving method — a losing streak automatically reduces position size because equity is lower. Kelly-based approaches are powerful but require reliable inputs for win rate and average win/loss; garbage inputs produce dangerous outputs.
Frequently Asked Questions
What percentage of my account should I risk per trade? Most trading educators recommend 0.5%–2% per trade. Use the lower end for high-frequency strategies, the upper end for low-frequency swing setups, and scale back during drawdowns.
How do I calculate lot size from risk amount and stop-loss pips?
Lot size = Risk amount ÷ (Stop pips × Pip value per lot). For EUR/USD, pip value per standard lot is $10, so $50 risk on a 30-pip stop gives 0.1667 lots.
Does risk calculation differ between currency pairs? Yes. Pip value per lot varies by pair and by whether USD is the base, quote, or absent from the pair. Recalculate pip value — and, for non-USD accounts, the account-currency conversion — for every new instrument.
How does leverage affect my risk per trade? Leverage changes how much margin a position requires, not how much money you lose when your stop triggers. A correctly sized 1% risk position risks 1% at any leverage level.
Can I use the same risk percentage for every trading strategy? No. Scalpers need lower per-trade risk because they take more trades per day; swing traders can use higher per-trade risk because they take fewer.
How do I factor spread into my stop-loss distance? Add the spread (in pips) to your technical stop distance before running the position-sizing formula. This gives the effective distance at which the stop actually triggers.
What is the difference between fixed-lot and fixed-percentage risk models? Fixed-lot uses the same volume on every trade, meaning risk in dollars drifts as the account grows or shrinks. Fixed-percentage adjusts lot size to keep risk as a constant fraction of current equity — the approach this calculator implements.
What We Could Not Verify
- Current live spreads by account tier at the time of writing. Spreads cited here (e.g., "from 1 pip" on Premium Pro) are taken from HFM's published account page; verify the indicative spread for the specific pair and session you trade.
- Contract specifications for non-Professional account tiers (Standard, Cent) in your specific jurisdiction — these differ by HFM regulatory entity.
- Whether any HFM platform build includes a dedicated on-chart risk calculator versus relying on MetaTrader's built-in trade calculator tools.
Before relying on any calculated lot size, confirm your own account's contract size, minimum increment, and margin-call thresholds in your platform's specification window.
Risk warning: CFDs and leveraged forex products are complex instruments and carry a high risk of losing money rapidly due to leverage. Retail investor accounts lose money when trading CFDs with most providers; the exact percentage varies by HFM entity and account type. You should consider whether you understand how CFDs work and whether you can afford to take the high risk of losing your money. Check the entity, terms and investor protections that apply in your jurisdiction before opening an account or trading.
Ready to Start Your Funded Trading Journey?
Join traders backed by $11M+ in verified payouts and a 4.7/5 Trustpilot rating. Compare HashHedge challenge plans, drawdown rules, and payout terms — apply code ha25 for the current discount.
Risk disclaimer: Challenge fees are non-refundable if you breach the rules. Prop trading involves significant financial risk. Past performance in a simulated environment does not guarantee results on a funded account. Only purchase if you understand the rules fully and can afford to lose the fee. Affiliate disclosure: HNL Growth earns a commission when you purchase a HashHedge challenge through links on this page.