Growth vs Value Stocks: Which Suits Your Strategy
Growth and value represent two fundamentally different approaches to selecting stocks—or stock CFDs—and understanding which fits your mindset matters before you place your first trade. Growth stocks...
Reviewed using our forex & CFD broker review methodology
Checked on: 2026-08-17 | Broker terms, regulation, and pricing can change. Always verify at the official PU Prime site before opening an account.
Affiliate Disclosure: HNL Growth may earn a commission if you open an account through our links, at no additional cost to you. Risk Warning: CFDs and leveraged forex products are complex instruments and carry a high risk of losing money rapidly due to leverage. 62.2% of retail investor accounts lose money when trading CFDs with this provider. Trading forex and CFDs may not be suitable for all investors. Consider your objectives, experience, and risk appetite before trading, and ensure you understand the risks involved. Broker Disclosure: PU Prime is a live, regulated multi-entity broker (not a simulated prop-firm evaluation) — trades are executed with real capital in live market conditions, subject to normal market risk. Which PU Prime entity holds your account depends on your country of residence and determines your leverage cap and protections.
Last verified: August 2026 | Editorial Team
Growth vs Value Stocks: Which Suits Your Strategy
Growth and value represent two fundamentally different approaches to selecting stocks—or stock CFDs—and understanding which fits your mindset matters before you place your first trade. Growth stocks are shares in companies expected to expand earnings quickly, typically reinvesting profit rather than paying dividends and trading at higher price multiples. Value stocks are shares trading cheaply relative to their fundamentals—earnings, book value, or cash flow—on the expectation the market will eventually re-rate them upward. Neither approach is objectively superior. The right choice depends on your time horizon, risk tolerance, and whether you are investing in physical equity or trading price movement through leveraged instruments. This guide explains both mechanically, shows how each plays out in practice, and helps you decide which suits your situation.
Disclosure: This page may contain affiliate links. We may earn a commission if you open an account through our links, at no extra cost to you.
What Growth Stocks Actually Are
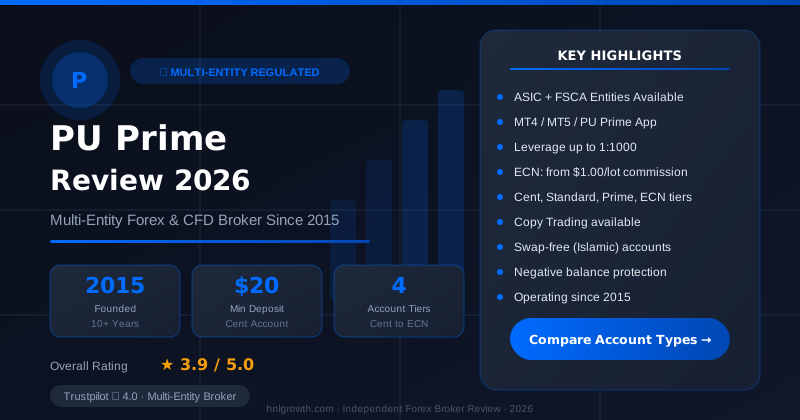
PU Prime — Multi-Entity Forex & CFD Broker
ASIC (AU) + FSCA (ZA) entities available · $20 min deposit (Cent) · MT4, MT5, PU Prime App · 4 account tiers
A growth stock is a share in a company whose earnings, revenue, or market share are expanding faster than the broader market or its sector peers. These companies typically reinvest all available capital back into the business—funding research, hiring staff, entering new markets—rather than distributing cash to shareholders as dividends.
Because the market prices in future expectations, growth stocks often trade at high valuation multiples. A price-to-earnings (P/E) ratio of 30, 50, or even triple digits is common when investors believe the company's earnings will multiply over the next five to ten years. High valuations make sense if the growth materialises; they become painful if it does not.
Growth stocks are commonly found in sectors where innovation drives competitive advantage—technology, biotech, renewable energy, and consumer internet are frequently cited examples, though sector composition shifts over time and individual company characteristics matter more than sector labels alone. The underlying logic is that business models capable of scaling with minimal marginal cost, or companies approaching a significant product or regulatory milestone, can generate earnings growth that justifies a premium today.
The trade-off is volatility. When earnings reports disappoint or forward guidance weakens, growth stocks can fall sharply. A 20% or 30% drawdown in a matter of weeks is not unusual. Growth investors accept this volatility in exchange for the possibility of multi-year returns that outpace the broader market.
What Value Stocks Actually Are
A value stock is a share trading at a discount to its intrinsic worth, based on metrics like earnings, book value, or free cash flow. The market has overlooked, underestimated, or penalised the company, creating an opportunity for patient investors who believe the share price will eventually reflect the underlying fundamentals.
Value stocks typically trade at low valuation multiples: a P/E ratio below the market average, a price-to-book ratio under 1.5, or a dividend yield above the sector median. These companies often operate in mature, stable industries—financials, utilities, energy, consumer staples, industrials—where growth is modest but cash generation is predictable. As with growth, these are generalisations; any sector can contain value opportunities depending on how individual businesses are priced at a given time.
Unlike growth stocks, value companies frequently return cash to shareholders through dividends or buybacks. A utility company generating steady cash flow sees little reason to hoard capital; it pays out a reliable dividend instead. This income component makes value stocks attractive to investors who need regular cash flow or prefer less price volatility.
The challenge with value investing is patience. A stock may remain cheap for months or years before the market recognises its worth. Sometimes the discount exists for a good reason—a structural headwind the market correctly prices in—and the stock never recovers. This is called a value trap, and distinguishing between genuine value and a justified discount is the core skill of value investing.
Growth vs Value: A Worked Example
To see how each approach plays out mechanically, consider two simplified scenarios. These are entirely fictional illustrations using hypothetical round numbers to demonstrate decision logic, not derived from real market data or actual trades.
Growth Stock Scenario
Imagine a trader identifies a cloud-software company trading at $100 per share. The company reported 40% year-over-year revenue growth, is reinvesting all cash into product development, pays no dividend, and trades at a P/E of 60—double the market average.
The trader believes the company will maintain strong growth for at least three years as enterprises shift legacy systems to the cloud. The high P/E is acceptable if earnings grow fast enough to justify it. The trader opens a position targeting a 50% gain over 18 months, sets a stop-loss at 20% to limit downside, and plans to monitor quarterly earnings closely.
Three months later, the company reports weaker-than-expected customer retention. The share price falls 25% in two days. The stop-loss is triggered, and the trade closes at a loss. The growth thesis did not materialise as quickly as anticipated, and the high valuation left no margin for disappointment.
This illustrates the growth trade-off: high potential returns, but rapid losses when expectations are not met. A trader accepts this risk because one successful growth position can, in principle, offset several smaller losses if positions are sized correctly.
Value Stock Scenario
Now consider a trader who identifies a regional bank trading at $40 per share with a P/E of 9, a price-to-book ratio of 0.8, and a 4% dividend yield. The stock has underperformed for two years due to concerns about loan defaults, but the bank's balance sheet appears solid, provisions appear adequate, and the market seems overly pessimistic relative to observable fundamentals.
The trader buys, expecting the discount to narrow as economic conditions stabilise and investors rotate back into financials. There is no expectation of explosive growth—just a gradual re-rating from a P/E of 9 toward 12 over two years, plus dividend income along the way.
A year passes. The stock drifts between $38 and $42. The dividend arrives quarterly, but the position is essentially flat. The trader holds, believing the thesis remains intact. Eighteen months in, interest rates rise, bank earnings improve, and the stock climbs to $50. The position closes with a 25% capital gain plus accumulated dividends.
This illustrates the value trade-off: lower volatility and income during the hold period, but long stretches of stagnation and the need for conviction during underperformance. Value investing rewards patience and discipline, not quick timing.
Note on CFD vs equity mechanics: Both examples above describe price movements as they would apply to direct equity ownership. If you trade these instruments as stock CFDs—common on leveraged platforms—the direction and logic of the thesis remain the same, but the mechanics differ materially. Leverage means a smaller adverse move produces a proportionally larger loss on your margin. Overnight financing costs accumulate daily and can erode or eliminate gains on positions held for weeks or months. Dividend entitlement also works differently: you do not own the underlying shares, so you do not receive dividends directly. The CFD-specific risks are covered in the section on stock CFD differences below.
Growth vs Value: Key Differences at a Glance
| Dimension | Growth Stocks | Value Stocks |
|---|---|---|
| Valuation level | High P/E, P/B, often exceeding market average | Low P/E, P/B, trading below market or sector average |
| Earnings pattern | Rapid expansion, sometimes negative current earnings | Stable or modest growth, established profitability |
| Dividends | Rarely paid; profit reinvested | Often paid regularly; steady income stream |
| Typical sectors | Technology, biotech, consumer internet, renewables (generalisations—individual company traits matter) | Financials, utilities, energy, industrials, consumer staples (generalisations) |
| Volatility | High; sharp reactions to earnings misses | Lower; less sensitive to short-term news |
| Time horizon | Typically 3–10 years for thesis to play out | Often 5+ years; requires patience through flat periods |
| Market conditions often favouring the style | Periods of economic expansion and technology sector leadership | Periods of rising rates, uncertainty, or rotation toward income and quality |
| Primary risk | Overpaying; growth fails to justify valuation | Value trap; discount is justified by structural decline |
Neither column is "better." The table shows two distinct risk-return profiles. Your personal fit depends on factors addressed in the sections below.
On historical performance: Style leadership shifts across market environments—periods of low interest rates and technology expansion have coincided with growth leadership in some markets; periods of rising rates and economic uncertainty have coincided with value outperformance in others. These are observable patterns, not predictable cycles. Neither style dominates all environments or all time periods, and past performance does not indicate future results.
Practising Both Styles Before Committing Capital
Before risking real money on either approach, practising on a demo account is a prudent step. A demo account lets you execute trades with virtual capital using live market prices, so you can learn the platform mechanics and observe how each style behaves in real conditions—without financial exposure.
Here is a practical framework for each style:
Growth practice:
- Identify companies with revenue or earnings growth rates noticeably above their sector peers, low or no dividends, and P/E ratios above the broader market.
- Open small demo positions, noting your thesis for each: why you expect growth to continue and what metrics you will monitor.
- Track quarterly earnings releases and observe how the price reacts to beats and misses.
- Set stop-losses at 15–20% below your entry. Observe whether they would have been triggered and whether the stock recovered.
- After three months, assess which positions worked, which did not, and whether you could tolerate the volatility emotionally and practically.
Value practice:
- Identify companies with P/E ratios below their sector average, stable or positive cash flow, and dividend yields above their sector median.
- Open small demo positions, noting why you believe the discount is unjustified and what catalyst might close the valuation gap.
- Hold for at least three months, tracking dividends, earnings, and any sector or macro developments affecting the stock.
- Note how often you feel the urge to exit during flat periods—value investing requires patience, and the demo experience reveals whether you have it.
- After six months, compare performance to your growth positions and assess which process felt more aligned with your natural decision-making.
PU Prime offers a demo account that you can use to practise trading with virtual capital. According to the account-opening page, the registration process takes approximately 10 to 15 minutes. Verify which instruments and account types are available to you before opening an account, and confirm that the instruments you plan to trade are accessible on demo, as conditions and available instruments may differ from live accounts.
Who Growth Stocks Suit (and Who They Don't)
Growth stocks tend to suit traders and investors with:
- A long time horizon. Growth theses often take years to unfold. If you need capital back within 12 months, the volatility may force you out at the wrong time.
- High risk tolerance. Drawdowns of 30% or more are not uncommon. You need the temperament to hold through sharp declines without panic-selling.
- No immediate income needs. Growth stocks rarely pay dividends. If you rely on investment income to cover living expenses, growth does not deliver that.
- Comfort with uncertainty. You are betting on future potential, not current cash flows. That requires conviction and the ability to tolerate being wrong for extended periods.
Growth stocks are a poor fit if you:
- Need predictable income or cannot tolerate multi-month periods of negative returns.
- Lack the time or interest to monitor earnings reports and sector trends closely.
- Are trading with capital you may need on short notice; liquidity risk is real when prices fall sharply.
Who Value Stocks Suit (and Who They Don't)
Value stocks tend to suit traders and investors with:
- Patience and discipline. You may wait years for the market to recognise a stock's worth. Impatience leads to selling too early.
- A preference for income. Many value stocks pay dividends, providing cash flow while you wait for price appreciation.
- Lower volatility tolerance. Value stocks typically fall less in downturns, though they also tend to rise more slowly in strong bull markets.
- A contrarian mindset. Value investing means buying what is currently unpopular. You need comfort going against prevailing sentiment.
Value stocks are a poor fit if you:
- Expect quick returns or need to compound capital rapidly over a short period.
- Cannot tolerate years of flat or negative performance while your thesis plays out.
- Lack the analytical discipline to distinguish genuine value from a value trap—a company trading cheaply because its business is genuinely impaired.
The Main Risks and Who This Is Not For
Both approaches carry specific risks beyond general market risk.
Growth stock risks:
- Overvaluation risk. Paying 50 times earnings only makes sense if growth continues for years. If it does not, the stock re-rates downward quickly.
- Earnings disappointment risk. A single weak quarter can trigger sharp losses, especially in crowded, momentum-driven names.
- Sector concentration risk. Growth portfolios often tilt heavily toward a small number of sectors, reducing diversification.
Value stock risks:
- Value traps. A stock may look cheap because the market correctly anticipates permanent decline—a disrupted business model, structural overcapacity, or sustained management failure.
- Opportunity cost. Years in a flat value position mean missing potential gains elsewhere. Even if the stock eventually rises, inflation and forgone returns reduce real-terms performance.
- Cyclical sensitivity. Many value sectors are cyclical. Buying at the wrong point in the cycle may mean holding through an entire downturn before seeing gains.
Additional risks when trading stock CFDs:
If you trade stock CFDs rather than buying physical shares—common on leveraged trading platforms—the following differences apply:
- Leverage amplifies both gains and losses. This is a general principle of leveraged instruments, not a statement of PU Prime's specific margin policy. As a simplified illustration of the principle: on a leveraged position, an adverse move of a given percentage in the underlying stock produces a proportionally larger loss relative to the margin posted. The exact leverage available, and the margin required, depends on the broker, the instrument, and your jurisdiction. Check current margin requirements directly with your broker before trading.
- Overnight financing costs. Holding a CFD position for weeks or months incurs daily financing charges. These accumulate and can erode or eliminate gains on long-horizon positions. Before entering a trade, estimate the projected financing cost over your intended holding period against your expected return. The specific rates vary by broker, instrument, and account type; confirm current rates directly before trading.
- No direct dividend entitlement. You do not own the underlying shares, so dividends are not received in the traditional sense. Brokers may credit or debit a dividend adjustment to long or short CFD positions, but the mechanics, timing, and amount differ from owning equity outright. Verify the specific policy with your broker before trading around dividend dates.
Both strategies are unsuitable if you cannot afford to lose your trading capital, or if you expect consistent profits regardless of market conditions. No investment style eliminates risk or delivers returns in every environment.
Common Mistakes Beginners Make
With growth stocks:
- Chasing momentum without a thesis. Buying a stock simply because it is rising leads to overpaying at peaks. Know why you expect growth to continue before entering.
- Ignoring valuation entirely. Even strong businesses can be overpriced. Paying very high multiples leaves no room for error.
- Failing to size positions appropriately. Growth stocks are volatile; concentrating too heavily in a single name magnifies the impact of one bad earnings report on your overall capital.
- Holding through obvious thesis breaks. If the reason you bought the stock no longer applies—competitive pressure, regulation, product failure—exit rather than waiting for a recovery that may not come.
With value stocks:
- Confusing "cheap" with "value." A low P/E alone does not signal opportunity. Understand why the stock is cheap and whether the discount is justified by current fundamentals or unjustified pessimism.
- Ignoring fundamental deterioration. A declining business at a low multiple may fall further. Be cautious of theses that depend on a turnaround without evidence that management has the capacity or plan to execute.
- Exiting too early. Value investing requires patience. Selling after six months of flat performance often means missing the eventual re-rating.
- Overconcentrating in cyclical sectors. Value portfolios can tilt heavily toward energy, materials, or financials. If those sectors face simultaneous headwinds, the entire portfolio suffers.
Mistakes common to both:
- Trading without a plan. Entering a position without defined entry, exit, and stop-loss levels leads to emotional decision-making.
- Misjudging time horizon. Growth and value strategies take time. Trading them on a weekly basis defeats the thesis and accumulates costs.
- Underestimating costs. Spreads, commissions, financing charges, and applicable taxes all erode returns. Factor them into your expected return before you trade.
Blending Both Styles: A Third Option
Some investors do not choose exclusively between growth and value. They hold both, either within a single portfolio or by adjusting allocation based on market conditions and personal conviction.
Blending offers diversification benefits. Growth and value stocks often move differently—when growth leads, value tends to lag, and vice versa. Holding both can smooth portfolio volatility and ensure participation in whichever style the market favours at a given time.
Any specific allocation between the two styles depends on personal conviction, portfolio size, time horizon, and risk tolerance—there is no universally optimal split. Some investors adjust allocation based on valuation spreads (the gap between growth and value multiples) or macroeconomic indicators, though timing such tilts reliably is difficult.
A hybrid approach called "growth at a reasonable price" (GARP) seeks companies with meaningful growth prospects but without extreme valuations—stocks that blend characteristics of both styles. A GARP investor might target companies growing earnings at a healthy rate while trading at a moderate P/E, avoiding both the stagnation risk of deep value and the overvaluation risk of pure growth. This approach requires more nuanced analysis than strict screening by a single metric, but aims to reduce downside volatility while maintaining upside participation.
Blending does not eliminate risk, but it reduces the chance of being entirely wrong-footed by a style rotation. If you lack strong conviction about which style will lead over the next three to five years, a blended approach is a reasonable response to that uncertainty.
A Simple Self-Check: Which Style Might Suit You?
Answer these questions honestly. There is no score; the exercise clarifies your natural leaning.
Time horizon: Can you hold a position for three to five years without needing the capital, or do you prefer to see results within 12 to 18 months?
- Long-term patience → leans value or long-term growth.
- Shorter horizon → favours growth only if you can tolerate significant volatility.
Income needs: Do you need regular cash flow from your investments, or can you reinvest all returns?
- Need income → leans value (dividends).
- No income need → either style may work depending on other factors.
Volatility tolerance: Can you hold through a sharp drawdown without panic-selling, or do sudden price drops cause you to exit prematurely?
- High tolerance → growth may be manageable.
- Lower tolerance → value typically offers less day-to-day volatility.
Conviction and patience: Can you stick with a thesis for years even when the market disagrees, or does prolonged underperformance erode your confidence?
- High conviction, patience → value may fit better.
- Prefer faster feedback → growth may suit better.
Research and monitoring: Are you willing to track quarterly earnings, sector trends, and competitive dynamics closely, or do you prefer a more passive, set-and-monitor approach?
- Active monitoring preferred → growth generally demands it.
- Passive approach preferred → value can be more forgiving of less frequent review.
If you lean toward patience, income, and lower volatility, value is worth exploring first. If you lean toward higher risk tolerance, no income requirements, and active monitoring, growth may fit better. Mixed answers suggest a blended approach.
Frequently Asked Questions
Which strategy has historically performed better?
Neither style dominates consistently across all time periods, markets, or measurement methodologies. Style leadership shifts with macroeconomic conditions—interest rates, inflation expectations, sector composition, and investor sentiment all influence which style leads at a given time. Treat historical patterns as context for understanding the two styles, not as a basis for predicting which will lead next. Past performance does not indicate future results.
Do growth stocks ever pay dividends?
Some do, but it is uncommon among early-stage growth companies. Paying dividends signals that a company has surplus cash beyond what it can profitably reinvest. Growth companies typically direct every available dollar into expansion. As companies mature and growth slows, many begin paying dividends—effectively transitioning toward value characteristics over time.
What sectors are typically associated with growth vs value?
Growth companies are frequently found in technology, biotech, renewable energy, and consumer internet—sectors where reinvestment drives competitive advantage. Value companies are more commonly found in financials, utilities, energy, industrials, and consumer staples—mature industries with predictable cash flows. These are generalisations. Sector classification is not fixed: a technology stock can become a value stock if growth slows and valuation falls, and a traditional sector company may trade at growth multiples in certain conditions. Individual fundamentals and current pricing matter more than sector labels.
Can I hold both growth and value stocks at the same time?
Yes. Holding both reduces the risk of missing the market's favoured style during any given period. The appropriate allocation depends on your personal risk tolerance, time horizon, and conviction. Blending does not eliminate risk, but it can reduce volatility and provide broader participation across market cycles.
What happens when growth expectations do not materialise?
The stock typically re-rates downward, often sharply. If a company growing strongly slows materially, the market reprices it to reflect the lower growth trajectory. High-valuation stocks have less cushion; a modest disappointment can trigger significant losses. This is why position sizing and stop-losses are particularly important in growth investing.
How do I know if a value stock is a value trap?
Value traps occur when a stock is cheap for a legitimate reason—declining market share, technological disruption, structural overcapacity, or sustained management failure. Commonly cited warning signs include falling revenue over multiple quarters, shrinking margins, rising debt, management guidance that consistently disappoints, and deteriorating competitive position. Genuine value opportunities more typically show stable or improving fundamentals—consistent cash flow, manageable debt, and a credible path to re-rating—just at a price the market has not yet recognised. Distinguishing between temporary pessimism and structural decline requires careful fundamental analysis. Ask specifically whether the discount reflects cyclical headwinds (potentially temporary) or permanent impairment (a trap).
Do these strategies work the same way when trading stock CFDs?
The investment thesis—growth or value—applies in the same direction, but the mechanics differ materially. Leverage means a move in the underlying stock creates a proportionally larger gain or loss on your margin. Overnight financing costs accumulate if you hold for weeks or months, affecting net returns. You do not receive dividends directly; brokers may credit or debit a dividend adjustment, but the mechanics and timing differ from owning shares. Understand these differences before applying either style via CFDs.
What to Verify Before Trading Stock CFDs
No live-account testing of PU Prime's platform underpins this guide. Before trading stock CFDs on growth or value names with any broker, verify the following directly:
- Regulatory status and jurisdiction: Confirm which entity regulates the broker in your jurisdiction and what client protections apply. PU Prime states it operates under the oversight of several financial authorities; its regulation page lists the entities and jurisdictions under which the group operates. The applicable entity, terms, and protections differ by region—check which apply to you specifically.
- Spreads and commissions: Check live spreads and commission structures for the specific stock CFDs you plan to trade. These vary by account type and instrument. PU Prime's spread and costs page provides indicative figures across Standard, Prime, and ECN account types; verify current rates on the platform before trading, as the broker notes that listed values are for reference only.
- Overnight financing rates: Identify the daily financing cost for the instruments you plan to hold. Multiply the daily rate by your expected holding period to estimate total financing cost, then compare this to your expected price move to establish a rough break-even threshold. This step is especially important for value-style positions held over months.
- Dividend adjustment policy: Confirm exactly how the broker handles dividend events on long and short CFD positions—the adjustment amount, timing, and any tax implications for your jurisdiction.
- Margin requirements and leverage: Confirm the margin required per position and the maximum leverage available for the instruments and account type you intend to use. Regulatory limits on leverage vary by jurisdiction.
- Platform execution and order types: Test order types, charting tools, and execution on a demo account before committing real capital. According to PU Prime's account-opening page, a demo account is available during the registration process; verify which instruments are accessible on demo before relying on it for style-specific practice.
- Account minimums: PU Prime's account-opening page states minimum deposits of $20 for a Cent account and $50 for a Standard account; verify current minimums and account type differences directly, as terms may change.
This checklist protects you from surprises and ensures the trading environment is compatible with your strategy.
Risk warning: CFDs and leveraged forex products are complex instruments and carry a high risk of losing money rapidly due to leverage. Consider whether you understand how these products work and whether you can afford to take the high risk of losing your capital. Check the entity, terms and protections that apply in your jurisdiction before trading.
Ready to Compare PU Prime Account Types?
PU Prime is a multi-entity broker — ASIC (Australia) and FSCA (South Africa) regulated entities offer stronger oversight, while most international clients are onboarded to the FSA Seychelles or FSC Mauritius entities. Four account tiers (Cent, Standard, Prime, ECN) range from a $20 minimum deposit to full ECN pricing.
Risk disclaimer: PU Prime is a live, regulated multi-entity broker — trading forex and CFDs is done with real capital under normal market risk (this is not a simulated prop-firm evaluation). PU Prime operates under multiple separate licenses (ASIC, FSCA, FSA Seychelles, FSC Mauritius); which entity holds your account depends on your country of residence and determines your leverage cap and protections — confirm this before funding. CFDs and leveraged forex products are complex instruments and carry a high risk of losing money rapidly due to leverage; 62.2% of retail investor accounts lose money when trading CFDs with this provider. Consider whether you understand how CFDs/forex work and whether you can afford the high risk of losing your money. Affiliate disclosure: HNL Growth earns a commission when you open a PU Prime account through links on this page.