Head and Shoulders Pattern: Rules, Targets and Failure Rate
The head and shoulders pattern is a price structure that signals a potential reversal from an uptrend to a downtrend — or, in its inverse form, from a downtrend to an uptrend. It earns attention...
Reviewed using our forex & CFD broker review methodology
Checked on: 2026-08-17 | Broker terms, regulation, and pricing can change. Always verify at the official PU Prime site before opening an account.
Affiliate Disclosure: HNL Growth may earn a commission if you open an account through our links, at no additional cost to you. Risk Warning: CFDs and leveraged forex products are complex instruments and carry a high risk of losing money rapidly due to leverage. 62.2% of retail investor accounts lose money when trading CFDs with this provider. Trading forex and CFDs may not be suitable for all investors. Consider your objectives, experience, and risk appetite before trading, and ensure you understand the risks involved. Broker Disclosure: PU Prime is a live, regulated multi-entity broker (not a simulated prop-firm evaluation) — trades are executed with real capital in live market conditions, subject to normal market risk. Which PU Prime entity holds your account depends on your country of residence and determines your leverage cap and protections.
Last verified: August 2026 | Editorial Team
Head and Shoulders Pattern: Rules, Targets and Failure Rate
The head and shoulders pattern is a price structure that signals a potential reversal from an uptrend to a downtrend — or, in its inverse form, from a downtrend to an uptrend. It earns attention because it defines three things simultaneously: a rule-based entry trigger (neckline close), a logical stop-loss position (just beyond the right shoulder), and a measurable price target (the head-to-neckline distance applied from the breakout point). What it does not provide is certainty. False breakouts are a normal feature of trading this pattern, not an exception, and results vary with confirmation discipline, market regime, and asset liquidity. This article explains the structure, the calculation, and the decision sequence you need before acting.
How the Pattern Builds, Phase by Phase
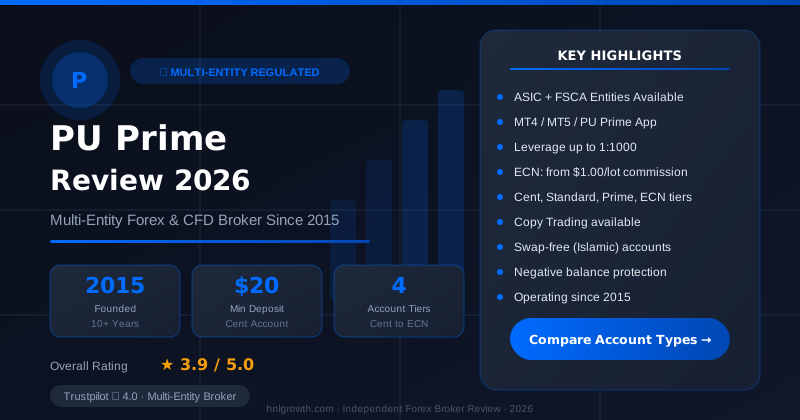
PU Prime — Multi-Entity Forex & CFD Broker
ASIC (AU) + FSCA (ZA) entities available · $20 min deposit (Cent) · MT4, MT5, PU Prime App · 4 account tiers
The classic head and shoulders forms at the end of an uptrend. The inverse variant forms at the end of a downtrend. Both follow the same sequential logic in opposite directions.
Left shoulder: Price rallies to a new high, then pulls back to a support level. Volume is typically elevated during this rally — buyers are still active.
Head: Price pushes higher again, making a peak that exceeds the left shoulder. The subsequent pullback returns to roughly the same support zone. Volume during this rally may start declining relative to the left shoulder — a first sign that buying pressure is softening.
Right shoulder: Price rallies a third time, but fails to reach the head's peak. It falls back toward the same support zone. Volume on this final rally is noticeably lighter than the head. This asymmetry between effort and result is the diagnostic signal: the uptrend is losing momentum.
Neckline: Draw a line connecting the two pullback lows (for the classic top) or the two rally highs (for the inverse bottom). This is the trigger threshold. It is not always horizontal — its slope matters, and that is covered in the identification section below.
Breakout: A closing price below the neckline (classic) or above it (inverse) completes the pattern and triggers the setup. A mid-candle breach is not sufficient — confirmation requires a full candle close.
For the inverse head and shoulders, every element is mirrored: the head is the lowest trough, volume is more explicitly required on the breakout (practitioner consensus, not a regulatory rule), and the target projects upward from the neckline.
Drawing the Pattern Correctly on Your Chart
Correct identification prevents mistaking a noisy retracement for a valid formation. Use this checklist before deciding a pattern exists.
Table T1 — Pattern Formation Checklist
| Condition | What to Look For | Status |
|---|---|---|
| Prior trend exists | Clear uptrend (top pattern) or downtrend (inverse) before formation begins | ✓ / ✗ / ? |
| Three distinct peaks or troughs visible | Left shoulder, head, right shoulder with clear boundaries | ✓ / ✗ / ? |
| Head is the highest peak (or deepest trough for inverse) | Head must exceed both shoulders in magnitude | ✓ / ✗ / ? |
| Right shoulder lower than head (higher for inverse) | Asymmetry in peak height is required; if right shoulder exceeds head, the pattern is invalid | ✓ / ✗ / ? |
| Volume declining from left shoulder to right shoulder | Each rally on progressively lighter volume indicates weakening momentum | ✓ / ✗ / ? |
| Neckline drawn across two anchor points and extended right | Connects the two troughs (top) or two peaks (inverse) | ✓ / ✗ / ? |
| Neckline slope identified | Downward slope on a top pattern is widely viewed as more clearly bearish; upward slope adds ambiguity and warrants extra confirmation | ✓ / ✗ / ? |
| No distorting events in the formation window | Earnings announcements, dividends, or macro events during formation can create misleading structure | ✓ / ✗ / ? |
On neckline slope: A downward-sloping neckline in a top pattern is generally regarded by practitioners as a cleaner bearish signal because each pullback is already making lower lows. An upward-sloping neckline suggests residual buying pressure and typically demands stronger volume confirmation at the break. This is an editorial consensus view based on widely cited technical analysis practice, not a backtested statistical claim.
Shoulder symmetry is not required, but notable asymmetry — especially a right shoulder that takes significantly longer to form than the left — should prompt caution. The reversal logic depends on comparable timeframes.
Prior trend duration: The uptrend (or downtrend for inverse) should be meaningful before the pattern begins. A structure forming on only a few days of prior movement carries less reversal significance than one forming after weeks of directional movement.
Confirming Before You Commit
This is the most operationally important section. Entering on a partial pattern or an unconfirmed neckline breach is the primary cause of loss on this setup.
Five-Point Confirmation Sequence (Ordered by Decision Weight)
1. Neckline close (required): Wait for a full candle to close below the neckline (classic) or above it (inverse). An intrabar move that reverses before the close is not confirmation. This is the non-negotiable first gate.
2. Volume on the breakout candle (strongly recommended): The breakout candle's volume should be meaningfully higher than the 20-period average volume on the same chart. For inverse patterns, volume expansion at the break is viewed by many practitioners as near-essential. For top patterns it is confirmatory rather than strictly required, but its absence should raise caution.
3. Timeframe validity (check before entry): The prior trend should be at least roughly twice the width of the shoulder-to-shoulder span. A pattern forming in three days on a daily chart after a three-week trend is structurally weaker than one where the prior trend ran for two months.
4. Secondary indicator alignment (optional, adds conviction): RSI showing divergence at the head (price made a higher high; RSI did not), MACD producing a bearish cross aligned with the neckline break, or OBV/CMF trending downward through the formation — any of these add analytical weight. None is required for entry, and adding too many prerequisites risks missing valid setups.
5. Risk:reward check (required before sizing): Calculate the target and the stop before entry. If the ratio is below approximately 1.5:1, the setup does not offer enough reward for the structural risk. This calculation is covered in detail in the next section.
False Breakouts: Common, Not Exceptional
False breakouts are a regular occurrence on this pattern. Price closes below the neckline, then reclaims it within one to three candles — sometimes sharply. Treating them as rare surprises leads to oversized positions and unplanned losses.
What a false breakout typically looks like: The breakout candle closes below the neckline but volume is below the 20-period average. The following candle gaps or closes back above the neckline. The right shoulder's low is not breached on a closing basis.
What to do: If price retests the neckline from below within three candles and closes back above it, treat the trade as invalid and exit at your stop. Do not average down or widen the stop.
Retest behaviour after a valid break: After a genuine neckline break, price frequently returns to test the neckline from the other side — neckline-as-resistance (classic) or neckline-as-support (inverse). This retest is not a failure; it is a common structural feature and can offer a second, sometimes lower-risk entry point with additional confirmation.
Table T4 — False Breakout vs Real Breakout Decision Framework
| Question | Yes → | No → |
|---|---|---|
| Did price close below the neckline on a full candle? | Proceed to next question | Wait; intrabar breach only |
| Did volume expand vs 20-period average on the breakout candle? | Higher conviction; proceed | Treat as suspect; reduce size or wait |
| Did the next 1–2 candles follow through in breakout direction? | Pattern holding; proceed | Watch for neckline retest |
| Did price retest neckline and fail to reclaim it (resistance held)? | Confirms the break; adds conviction | Monitor; if neckline reclaimed on a close, exit |
| Is a momentum signal (RSI, MACD) aligned with the break? | High-conviction setup | Consider smaller position size until follow-through confirms |
Calculating Your Entry, Stop, and Target
This section provides the mechanics and a worked example you can adapt to your own setups.
Entry rule: Enter on the first confirmed candle close below the neckline (classic) or above it (inverse). Do not enter mid-candle.
Stop-loss placement: Place the stop just above the right shoulder peak for a bearish (classic) pattern, or just below the right shoulder trough for a bullish (inverse) pattern. The reasoning: if price returns above the right shoulder, the pattern structure is broken regardless of whether the neckline was breached.
Price target formula:
Pattern height = Head price − Neckline price at the head's vertical
Target        = Breakout price − Pattern height  (classic top)
Target        = Breakout price + Pattern height  (inverse bottom)
Table T3 — Worked Examples
| Input / Output | Bearish Classic Example | Bullish Inverse Example |
|---|---|---|
| Head peak price | 1.3200 | 1.2000 |
| Neckline price at head vertical | 1.2800 | 1.2400 |
| Pattern height | 0.0400 (400 pips) | 0.0400 (400 pips) |
| Breakout price (neckline close) | 1.2780 | 1.2420 |
| Price target | 1.2780 − 0.0400 = 1.2380 | 1.2420 + 0.0400 = 1.2820 |
| Stop-loss (right shoulder) | 1.3050 (just above right shoulder peak) | 1.2150 (just below right shoulder trough) |
| Risk (entry to stop) | 270 pips | 270 pips |
| Reward (entry to target) | 400 pips | 400 pips |
| Risk:reward ratio | ~1.48:1 | ~1.48:1 |
In these examples the ratio sits just below the 1.5:1 threshold used earlier. A trader should decide before entry whether that ratio is acceptable given their overall strategy, or whether they wait for a tighter stop opportunity such as entering on the neckline retest rather than the initial break.
This calculation template applies to any asset and any timeframe. The numbers change; the formula does not.
Disclosure: This page may contain affiliate links. We may earn a commission if you open an account through our links, at no extra cost to you.
Practise the calculation before using real capital. Work through the checklist and the formula on historical charts, then apply it on a demo account to build familiarity with entry placement, stop management, and target adjustment without financial risk. PU Prime offers a demo account where you can test the full entry-to-exit process on live market prices.
Practise head and shoulders entries on a PU Prime demo account
Timeframe Selection
Table T5 — Timeframe Selection Guide
| Trader Holding Period | Recommended Chart Timeframe | Typical Pattern Formation Duration | Notes |
|---|---|---|---|
| Intraday (hours) | 15-minute or 1-hour chart | 2–8 hours | Patterns form and break quickly; more noise, more false breakouts; tight spreads matter more |
| Day trader (1–3 days) | 1-hour or 4-hour chart | 1–3 days | Better signal-to-noise balance; volume data more meaningful across sessions |
| Swing trader (1–2 weeks) | 4-hour or daily chart | 1–3 weeks | Most commonly cited timeframe for this pattern; prior-trend requirement easier to satisfy |
| Position trader (weeks–months) | Weekly or daily chart | 1–4 months | Higher-conviction signals historically; wider stops required; spread cost less significant relative to target |
None of these timeframes is categorically more reliable. Shorter timeframes carry more noise and higher false-breakout frequency; longer timeframes produce fewer setups but with wider stops that require appropriate position sizing.
Where the Pattern Breaks Down
Honest assessment of this pattern's limitations is as important as learning the structure.
False breakouts are the primary risk. They are not edge cases. When the breakout candle lacks volume or market conditions are thin (overnight session, pre-data windows, low-liquidity instruments), the neckline breach may reflect short-term imbalance rather than genuine directional commitment.
Market regime matters. Pattern-based reversal strategies are more coherent in trending markets with clear directional momentum. In low-volatility, range-bound conditions, apparent head-and-shoulders formations are frequent but often resolve into continuation rather than reversal.
Variable results in practice. Traders in practitioner communities report that results with this pattern can be inconsistent, and that initial success sometimes gives way to deteriorating performance. The more analytically plausible explanations are: confirmation discipline declining after early wins; market regime shifting from trending to choppy; and the difference between identifying patterns on historical charts versus spotting them in real time before the neckline is reached. Neither dismissing nor validating these reports is appropriate; maintaining a personal trade log and reviewing adherence to your confirmation checklist — not just outcome — is the more productive response.
Psychology traps. Two recurring issues:
- Entering early because the pattern looks complete before the neckline closes. It is not complete until the neckline closes.
- Exiting a valid trade on the neckline retest, mistaking a structural feature for a reversal failure.
Layering in Supporting Signals
Secondary indicators do not replace the confirmation checklist. They add conviction when aligned.
RSI divergence at the head: If price made a higher high at the head but RSI made a lower high, this divergence suggests weakening momentum — consistent with the reversal thesis. This is one of the cleaner analytical additions to the setup.
MACD crossover: A bearish MACD cross (classic) or bullish cross (inverse) aligned with or preceding the neckline break provides convergence. A MACD that is trending against the pattern direction should prompt extra caution.
Moving-average proximity: A right shoulder forming below a key moving average (such as the 50-period or 200-period on the chart's timeframe) in a classic top pattern adds analytical weight to the bearish case. The MA is acting as dynamic resistance at the right shoulder.
OBV or CMF directional shift: On-Balance Volume declining through the formation (classic top) indicates distribution — institutional selling as price attempts higher. Chaikin Money Flow turning negative adds the same signal. For inverse patterns, these indicators turning positive is viewed by many practitioners as near-confirmatory alongside volume expansion.
Frame all of these as higher-conviction additions when present, not prerequisites. A setup that has a clean neckline close and strong breakout volume but a neutral MACD can still be valid.
Table T2 — Confirmation Signals Matrix
| Signal | Classic Top Pattern | Inverse Bottom Pattern | Weight |
|---|---|---|---|
| Neckline close (full candle, not intrabar) | Required | Required | Primary |
| Volume spike vs 20-period average at breakout | Strongly recommended | Required (practitioner consensus) | Primary |
| Prior-trend length ≥ approx. 2× shoulder width | Strongly recommended | Strongly recommended | Secondary |
| Candlestick confirmation at breakout candle (e.g., engulfing, momentum candle) | Optional | Optional | Supporting |
| RSI divergence at head | Optional | Optional | Supporting |
| MACD crossover aligned with neckline break | Optional | Optional | Supporting |
| OBV or CMF directional shift through formation | Optional | Strongly recommended | Supporting |
Platform Features That Support This Approach
The quality of your execution environment affects how reliably you can apply a confirmation-first approach. These are decision criteria to evaluate when assessing any broker or platform — not a feature endorsement for any specific product.
Table T6 — Platform Feature Checklist for Pattern Traders
| Feature | Why It Matters for This Pattern | Question to Ask Your Broker |
|---|---|---|
| Trendline and neckline drawing tools | Accurate neckline identification requires precise, anchored line drawing across multiple timeframes | Can I draw, label, and lock trendlines across timeframes without them resetting? |
| Built-in volume indicators (OBV, CMF, or equivalent) | Volume confirmation is a load-bearing part of this setup; calculating it manually from a bar chart is impractical | Does the platform include OBV, CMF, or Chaikin Oscillator natively, or do I need a custom indicator? |
| Price alert on level breach | Breakouts can occur at any hour; setting an alert on the neckline price avoids constant screen-watching | Can I set an alert that triggers when price closes through a specific level, not just touches it intrabar? |
| Multi-timeframe chart view | Checking pattern context on a higher timeframe while executing on a lower timeframe is standard practice | Can I view two or more timeframes simultaneously without switching windows? |
| Execution quality at neckline level | Slippage on breakout entries can erode the risk:reward ratio calculated before entry | What is the typical spread on my target instrument during the London or New York open, when most breakouts occur? (Check current spreads at PU Prime's spreads and costs page) |
| Demo or paper trading availability | Essential for practising the confirmation checklist before risking capital | Can I practise the full entry-to-exit workflow on a demo with live market prices? |
| Mobile execution quality | Useful for managing open trades, less reliable for initial pattern identification | Is the mobile app execution equivalent to the desktop platform for market and limit orders? |
PU Prime offers MT4, MT5, and a proprietary mobile app, and publishes indicative spreads by account type and instrument at their spreads and costs page. Spreads are variable and the published figures are indicative — check the platform directly for current values before entering a trade.
PU Prime is regulated by the Financial Services Authority of Seychelles (FSA), the Financial Services Commission of Mauritius (FSC), the Financial Sector Conduct Authority of South Africa (FSCA), and the Capital Market Authority of the UAE (CMA). The entity and protections that apply to you depend on your jurisdiction — verify which entity serves your country of residence at PU Prime's regulation page before opening an account.
Explore PU Prime's demo account and charting tools
Frequently Asked Questions
Does the pattern work on all timeframes? The formation can appear on any timeframe from intraday minutes to monthly charts. Lower timeframes produce more patterns but with higher false-breakout frequency and narrower context. The confirmation sequence — neckline close, volume, prior-trend length — applies equally across timeframes, but is harder to satisfy cleanly on very short timeframes where volume data is noisier.
What is the success rate? No verified, peer-reviewed, or broker-backtested figure for head and shoulders success rates is available in the public literature that would be appropriate to cite here. Traders report variable results. Rather than relying on any quoted percentage, maintain a personal trade log and measure your own adherence to the confirmation checklist against outcomes. That is the most actionable answer.
Can I trade this pattern on forex, stocks, and commodities? Yes. The structure appears across liquid asset classes. Practically, volume data is more reliable for exchange-traded instruments (stocks, futures) than for spot forex, where true volume is not centrally reported and tick volume is used as a proxy. This makes volume confirmation slightly less definitive in spot forex than in equity or futures markets — worth factoring into your confirmation weighting.
What happens if the neckline is sloped? A downward-sloping neckline in a classic top is widely viewed by practitioners as a cleaner bearish signal. An upward-sloping neckline in a classic top implies residual buying pressure and typically requires stronger volume confirmation at the break to maintain validity. For inverse patterns, the same logic applies in reverse. A significantly sloped neckline also changes the breakout price, so recalculate the entry level carefully.
How is the inverse pattern different in practice? The inverse head and shoulders signals a reversal from a downtrend to an uptrend. The head is the lowest point, volume is more explicitly viewed as required on the breakout (vs. strongly recommended for classic tops), and the target projects upward. The confirmation logic and calculation formula are the same structure in the opposite direction. Do not treat them interchangeably — a top pattern and a bottom pattern in similar-looking chart conditions carry different contextual implications.
Risk Warning
Risk warning: CFDs and leveraged forex products are complex instruments and carry a high risk of losing money rapidly due to leverage. Technical analysis, including the head and shoulders pattern, does not guarantee outcomes. Past pattern behaviour on historical charts does not predict future results. Consider whether you understand how these products work and whether you can afford to take the high risk of losing your capital. Check the entity, terms, and protections that apply in your jurisdiction before trading. PU Prime operates under multiple regulatory entities; the protections available to you depend on which entity applies in your country of residence. Full regulatory details are available at puprime.com/regulation/.
Ready to Compare PU Prime Account Types?
PU Prime is a multi-entity broker — ASIC (Australia) and FSCA (South Africa) regulated entities offer stronger oversight, while most international clients are onboarded to the FSA Seychelles or FSC Mauritius entities. Four account tiers (Cent, Standard, Prime, ECN) range from a $20 minimum deposit to full ECN pricing.
Risk disclaimer: PU Prime is a live, regulated multi-entity broker — trading forex and CFDs is done with real capital under normal market risk (this is not a simulated prop-firm evaluation). PU Prime operates under multiple separate licenses (ASIC, FSCA, FSA Seychelles, FSC Mauritius); which entity holds your account depends on your country of residence and determines your leverage cap and protections — confirm this before funding. CFDs and leveraged forex products are complex instruments and carry a high risk of losing money rapidly due to leverage; 62.2% of retail investor accounts lose money when trading CFDs with this provider. Consider whether you understand how CFDs/forex work and whether you can afford the high risk of losing your money. Affiliate disclosure: HNL Growth earns a commission when you open a PU Prime account through links on this page.