High-Yield Bonds Explained: Risk, Return and Access
High-yield bonds are corporate debt securities that carry a credit rating below investment grade—meaning rated Ba1 or lower by Moody's, or BB+ or lower by S&P and Fitch. Because issuers carry a...
Reviewed using our forex & CFD broker review methodology
Checked on: 2026-08-17 | Broker terms, regulation, and pricing can change. Always verify at the official PU Prime site before opening an account.
Affiliate Disclosure: HNL Growth may earn a commission if you open an account through our links, at no additional cost to you. Risk Warning: CFDs and leveraged forex products are complex instruments and carry a high risk of losing money rapidly due to leverage. 62.2% of retail investor accounts lose money when trading CFDs with this provider. Trading forex and CFDs may not be suitable for all investors. Consider your objectives, experience, and risk appetite before trading, and ensure you understand the risks involved. Broker Disclosure: PU Prime is a live, regulated multi-entity broker (not a simulated prop-firm evaluation) — trades are executed with real capital in live market conditions, subject to normal market risk. Which PU Prime entity holds your account depends on your country of residence and determines your leverage cap and protections.
Last verified: August 2026 | Editorial Team
High-Yield Bonds Explained: Risk, Return and Access
High-yield bonds are corporate debt securities that carry a credit rating below investment grade—meaning rated Ba1 or lower by Moody's, or BB+ or lower by S&P and Fitch. Because issuers carry a higher probability of default than investment-grade companies, they compensate buyers with a larger coupon. The result is a higher headline yield, but that yield comes bundled with meaningful credit risk, price volatility that can approach equity-level swings, and liquidity that can thin sharply in stressed markets. For investors deciding whether to add high-yield exposure, the core question is not whether the yield is attractive in isolation but whether the spread over safer alternatives adequately compensates for those risks—and which vehicle delivers that exposure most efficiently after fees.
Two Products Share the Name—Which One Are You Looking For?
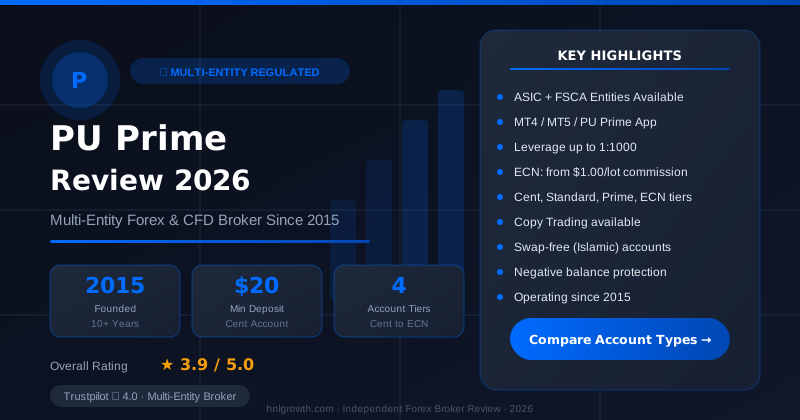
PU Prime — Multi-Entity Forex & CFD Broker
ASIC (AU) + FSCA (ZA) entities available · $20 min deposit (Cent) · MT4, MT5, PU Prime App · 4 account tiers
Search for "high yield" and results will include two structurally different products: high-yield bonds and high-yield savings accounts. They are not related.
High-yield savings accounts are deposit products offered by banks and credit unions. They carry deposit insurance protection in many jurisdictions and are appropriate for capital preservation. High-yield bonds are unsecured corporate debt instruments with credit risk, price volatility, and no deposit guarantee.
A savings account offers capital safety and a modest rate. A high-yield bond offers a higher coupon but exposes the holder to the possibility of partial or total loss if the issuer defaults. Comparing their yields is not a like-for-like exercise; the bond's excess return is compensation for risk, not a free upgrade. The rest of this article covers bonds only.
What Makes a Bond "High Yield"?
The label comes from the credit rating assigned by one of the three major agencies: Moody's, S&P Global Ratings, or Fitch Ratings. Each agency publishes a rating scale, and the dividing line between investment grade and high yield falls at a specific notch.
Credit Rating Boundary Reference
| Agency | Investment Grade (lowest rung) | High Yield (highest rung) | Distressed / Near Default |
|---|---|---|---|
| Moody's | Baa3 | Ba1 | Caa / C / D |
| S&P | BBB− | BB+ | CCC / CC / D |
| Fitch | BBB− | BB+ | CCC / CC / D |
Sources: Moody's Rating Symbols and Definitions; S&P Global Ratings Definitions; Fitch Ratings Definitions. Verify current designations against each agency's published glossary, as terminology is periodically updated.
A bond that was investment grade and gets downgraded across this line becomes a fallen angel. Fallen angels are often mechanically sold by institutional funds that are prohibited from holding sub-investment-grade debt, which can push prices below fundamental value at the moment of downgrade and create potential recovery upside for investors willing to hold through the dislocation.
The mirror situation is a rising star: a high-yield issuer whose creditworthiness is improving and is approaching the investment-grade boundary. Rising stars tend to trade at a premium within the high-yield universe because the market prices in an anticipated upgrade, offering a different risk profile than pure speculative-grade issuances.
The word "junk" is sometimes used interchangeably with high yield. It dates to a specific era of leveraged buyout financing in the 1980s and is imprecise as a description today. The high-yield universe spans from BB-rated companies—large, established businesses one notch below investment grade—down to CCC-rated issuers in genuine financial distress. Risk levels vary materially across that range. A BB-rated large-cap company with stable cash flows occupies a fundamentally different part of the risk spectrum than a CCC-rated issuer facing near-term refinancing pressure; treating them as equivalent misrepresents the category. The category is not monolithic.
The Risk-Return Equation
Default risk
The long-run annual default rate for high-yield bonds has averaged approximately 4–5%, based on the series of annual default studies published by Moody's Investors Service and S&P Global Ratings. This is an annual rate, not a cumulative lifetime figure—a common misreading that leads investors to underestimate the compounding effect over multi-year holding periods. Readers should consult the most recent edition of either agency's annual default study for current data, as the precise figure varies across publication years and universe definitions.
Default rates are not stable across the cycle. During the 1989–90 credit market dislocation, annual default rates in the high-yield market reached the upper single digits according to Moody's and S&P historical default research, and during the early months of the COVID-19 pandemic the trailing 12-month default rate climbed to approximately 9% according to S&P Global Ratings default research published in 2020–2021. Exact figures vary depending on the universe definition and whether loans are included alongside bonds. Consult the relevant agency's published report directly for precise figures and universe definitions.
What these rates imply practically: at a 5% annual default rate and an average recovery of roughly 40 cents on the dollar—a long-run figure cited across Moody's and S&P default study series, though it varies across studies and periods—the expected annual loss from defaults alone is approximately 3 percentage points (5% × 60% loss-given-default). Any yield spread below that threshold, after accounting for fees and taxes, implies the compensation for credit risk on a long-run expected-value basis is insufficient. Because default study methodologies, universe definitions, and recovery rate calculations differ across agencies and vintages, treat these figures as directional rather than precise; verify the current edition of each agency's published study before making an investment decision.
Volatility and spread dynamics
High-yield bond price volatility is lower than equity volatility in normal market conditions but can approximate it during credit stress. The mechanism is credit spread widening: when markets become risk-averse, the premium investors demand to hold high-yield debt over comparable government bonds expands sharply, pushing bond prices down regardless of whether the issuer is actually in default.
High-yield bonds typically have shorter maturities than investment-grade debt. Based on ICE BofA and Bloomberg index composition data, high-yield indices have historically centred on 5–7 year maturities, compared to 10–30 years for many investment-grade benchmarks. Index composition changes over time; verify current figures from the relevant index provider's factsheet before relying on this comparison. Shorter maturity means lower interest rate duration: a 1% rise in government bond yields produces a smaller price impact on a 6-year bond than on a 20-year bond. This makes high-yield relatively less sensitive to rate moves than long-duration investment-grade bonds.
However, this is a common misunderstanding among beginners. Lower interest rate duration does not mean lower overall risk in a rising-rate environment. If rate increases reflect deteriorating economic conditions, credit spreads can widen simultaneously with rates, producing a double loss: falling prices from spread widening compounded by the rate-duration effect. Both must be assessed together.
High-Yield Risk Profile at a Glance
| Metric | High-Yield Bonds | Investment-Grade Bonds | S&P 500 Equities |
|---|---|---|---|
| Long-run annual default rate | ~4–5% | <0.5% | N/A |
| Price volatility | Moderate-High | Low-Moderate | High |
| Typical maturity | 5–7 years (historical) | 10–30 years | N/A |
| Interest rate duration | Lower | Higher | N/A |
| Liquidity in stress | Lower | Higher | Higher |
Indicative figures based on published index data and Moody's/S&P default study series. All data points are historical and subject to change; verify current figures from primary sources at the time of your investment decision. Default rates are long-run annual averages; individual periods can be significantly higher or lower. Verify current index composition from relevant index provider factsheets.
High-yield bonds are not appropriate for investors who need capital preservation, cannot tolerate multi-year periods of negative returns, or require reliable liquidity at short notice. The asset class suits investors with a multi-year time horizon, a genuine risk tolerance for default-driven losses, and a portfolio context where the high-yield allocation represents a defined and limited share of total holdings.
Choosing Your Vehicle: ETFs, Funds, or Individual Bonds
Most retail investors cannot practically access high-yield bonds by purchasing them directly. Individual bond lots typically require minimum purchases of $100,000–$200,000, bid-ask spreads on individual corporate bonds are wide relative to exchange-traded markets, and achieving adequate diversification across issuers and sectors to offset single-name default risk demands a portfolio of significant scale. Direct bond ownership is the domain of institutional investors—pension funds, insurance companies, and large banks dominate direct holdings for structural and regulatory reasons.
For retail investors, the practical choice is between a high-yield ETF and a high-yield mutual fund.
ETFs trade on exchange at market prices throughout the session, offer transparent holdings, and carry low annual expense ratios. Widely tracked high-yield indices are covered by multiple ETF providers, giving investors choice on fee level and index methodology.
Mutual funds may offer active management—a portfolio manager selecting individual bonds based on credit research rather than replicating an index. Active management introduces the possibility of outperforming the index, but it also introduces manager risk and a higher expense ratio. The evidence that active management consistently outperforms passive high-yield funds after fees is mixed.
Fee Erosion on a $10,000 High-Yield Position
The difference between a low-cost and a moderate-cost fund may appear small in percentage terms but compounds meaningfully over a holding period. The table below uses 7% as an illustrative gross annual yield for comparison purposes only. This figure is not a projection, a current market rate, or a typical return. Actual high-yield fund yields fluctuate with credit spreads, interest rates, and defaults; current yields may be materially higher or lower. The sole purpose of this table is to show how expense ratio differences compound over time—do not interpret the output values as return forecasts.
| Expense Ratio | Gross Annual Yield (Illustrative Only) | Year 1 Net Value | Year 3 Net Value | Year 5 Net Value |
|---|---|---|---|---|
| 0.20% p.a. | 7.0% | $10,680 | $12,166 | $13,864 |
| 0.50% p.a. | 7.0% | $10,650 | $12,087 | $13,728 |
| 1.20% p.a. | 7.0% | $10,580 | $11,888 | $13,370 |
Illustrative only. Assumes constant gross yield, no defaults, no taxes, and full reinvestment of income. Actual returns will differ materially. Expense ratios shown are representative examples for comparison purposes only; verify current ratios from official fund prospectuses (SEC EDGAR for U.S.-registered funds) or official fund manager factsheets before investing.
At the 0.20% expense ratio row, the five-year illustrative net value is approximately $494 higher than at the 1.20% row on the same $10,000 starting position. On a larger position or a longer holding period, that gap widens substantially. Fee sensitivity is one of the strongest arguments for ETFs over actively managed mutual funds for cost-conscious retail investors.
Disclosure: This page may contain affiliate links. We may earn a commission if you open an account through our links, at no extra cost to you.
What to Check Before You Invest
Sector concentration
High-yield indices have historically carried meaningful concentration in sectors such as energy, telecoms, and media, because these sectors often finance operations and acquisitions with leveraged debt. However, index composition changes over time and varies by index provider and vintage. Consult the current index methodology document and the fund's most recent holdings disclosure rather than relying on historical descriptions. A single high-yield ETF that tracks a standard index may carry more sector concentration than its diversified label implies. Concentration in one sector means a sector-specific shock—an oil price collapse, for example—can affect a meaningful portion of the portfolio at once.
Duration assumptions
As discussed above, short maturity does not equal low risk in a risk-off environment. Review the fund's effective duration and understand that credit spread widening can produce price losses that exceed what interest rate math alone would suggest.
Liquidity in stress
High-yield ETFs trade on exchange and maintain intraday liquidity under normal conditions. In a severe market dislocation, ETF trading spreads can widen and the relationship between an ETF's market price and its net asset value can disconnect temporarily. Individual bond liquidity can deteriorate sharply. Know the fund's underlying market depth and have a realistic exit plan before you need it.
Tax treatment of coupon income
Coupon income from high-yield bonds is typically taxed as ordinary income rather than at preferential capital gains rates in many jurisdictions, which can materially reduce after-tax yield. Tax treatment varies by jurisdiction, account type, and whether the bond is held directly or through a fund wrapper. Consult a qualified tax adviser before making a high-yield allocation decision—particularly if you are comparing net after-tax returns across asset classes or account structures.
Common Mistakes Beginners Make
Chasing headline yield without accounting for fees. A fund advertising a 7% yield and charging a 1.2% expense ratio delivers 5.8% before taxes and before defaults. Compare net-of-fee yield across vehicles, not gross coupon.
Confusing short maturity with low risk. Shorter maturity reduces interest rate sensitivity but does not reduce credit risk or spread-widening risk. Many high-yield issuers that default do so within five years of issuance.
Over-concentrating in a single fund or sector. One high-yield ETF gives index-level diversification across issuers but may still carry concentrated sector exposure. Two or three funds covering different regional or quality segments within high yield provides broader coverage.
Ignoring the credit cycle. High-yield spreads tighten in expansion and widen in contraction. Entering at historically tight spreads reduces the compensation available for default risk. Monitoring current spread levels relative to historical ranges—available from ICE BofA and Bloomberg index data—gives context on whether the current market is pricing high-yield attractively or expensively.
Treating the category as monolithic. A fund's average rating and its distribution across rating subcategories materially affects its risk profile. Review the full rating breakdown, not just the headline average.
How to Explore High-Yield Exposure on PU Prime
PU Prime is a CFD broker that states it is regulated by multiple financial authorities. The applicable regulatory entity and the protections that flow from it depend on your jurisdiction; the broker's own notices confirm that its affiliated entities are not established or operating in all regions. Verify which entity and which protections apply to you directly on the official regulation page before opening an account.
PU Prime's platform lists bond CFDs and ETF CFDs under its instrument categories, which allows traders to take a leveraged position on price movements in debt securities and bond-related ETFs without taking delivery of the underlying instruments. This is a different structure from purchasing a bond or a fund outright: CFD positions involve leverage, overnight swap charges, and no entitlement to coupon income in the conventional sense. The swap cost on a multi-day CFD position is a holding cost that accumulates separately from the spread; the net return profile of a leveraged CFD position will therefore differ—potentially materially—from the coupon income a direct bondholder receives. Because no swap rate figures were available for inclusion here, check the current rates in MT4, MT5, or the PU Prime mobile app before placing any multi-day trade. PU Prime's own spreads and costs page notes that all listed values are for reference only and that the platform is the authoritative source for current figures.
The spreads and costs page lists available instruments across the Bonds and ETFs categories for Standard, Prime, and ECN account types. Instrument availability and specific trading conditions vary by jurisdiction; confirm what is accessible in your region before proceeding.
Checklist: What to Verify Before Opening a Live Account
Rather than describing outcomes that cannot be verified independently, the following checklist identifies the specific information you should confirm directly with PU Prime before committing capital:
- Instrument availability: Which specific bond and ETF CFD instruments are listed and tradeable in your jurisdiction
- Margin requirements: The minimum position size and margin requirement for each instrument you intend to trade
- Swap rates: The applicable long and short swap rates, since these accumulate as a holding cost on any position held overnight and are distinct from the spread
- Regulatory entity: Which specific regulatory body and licence covers your account, and what client money protections apply—use the official regulation page as your primary reference
- Account minimums: According to PU Prime's account-opening page, the Standard account requires a $50 minimum deposit and the Cent account requires $20; verify current conditions on the official site before proceeding, as account terms are subject to change
A demo account lets you navigate the instrument list, place practice orders, and observe how leverage affects position size and margin requirements without risking capital. This is a practical way to assess whether the available instruments and platform mechanics suit your intended strategy before funding a live account.
Opening a live account requires identity verification—a valid passport or national ID plus proof of address dated within three months—in addition to the minimum deposit.
Frequently Asked Questions
What credit rating makes a bond high yield? A bond is classified as high yield when rated Ba1 or below by Moody's, or BB+ or below by S&P and Fitch. The boundary between investment grade (BBB−/Baa3) and high yield (BB+/Ba1) is the key dividing line. Bonds below this line carry elevated default probability and trade at a yield premium to compensate.
What is the historical default rate for high-yield bonds? The long-run annual average is approximately 4–5%, based on Moody's and S&P annual default study series. This is an annual rate, not a cumulative figure. During stress periods it has reached higher levels—around 9% in the early COVID-19 period according to S&P Global Ratings research published in 2020–2021—and falls well below average in expansionary years. Consult the most recent edition of either agency's published default study for the current figure and the exact universe definition used.
What is a junk bond yield? "Junk bond" is an informal term for a high-yield bond. The yield refers to the annual coupon income relative to the bond's price. Because junk bonds carry higher default risk, they trade at a yield premium over comparable government bonds—this difference is the credit spread. Junk bond yields fluctuate with both interest rates and the size of that spread.
Should I buy individual high-yield bonds or use a fund? For most retail investors, a fund or ETF is more practical. Individual bonds require large minimum purchases, produce concentrated single-name exposure, and carry wide bid-ask spreads. ETFs provide diversification across many issuers at low cost and trade like shares on an exchange.
Do high-yield bonds fall when interest rates rise? Their interest rate sensitivity (duration risk) is lower than for long-dated investment-grade bonds because maturities are shorter. However, if rising rates reflect economic deterioration, credit spreads can widen simultaneously, compounding losses. Both effects operate in parallel in a risk-off rate-rise environment.
What is the difference between a fallen angel and a rising star? A fallen angel was investment-grade and was downgraded below the BBB−/Baa3 threshold. A rising star is a high-yield issuer whose creditworthiness is improving toward investment grade. Both subcategories have different risk and return characteristics than bonds issued originally as high yield.
Can I trade high-yield bond exposure through a CFD broker? Some CFD brokers, including PU Prime, list bond CFDs and ETF CFDs that reference bond markets. These products provide leveraged price exposure but do not transfer bond ownership or coupon entitlement in the traditional sense; the return profile of a CFD position differs from that of a direct bondholder, particularly over multi-day holding periods where swap charges accumulate. Review the instrument specifications, margin requirements, and current swap costs before trading. Leverage amplifies both gains and losses.
Is high-yield investing suitable for beginners? The asset class carries default risk, price volatility, and liquidity risk that make it unsuitable for investors who cannot absorb a sustained drawdown or who need capital preservation. Beginners who want exposure are better served by a diversified low-cost ETF rather than individual bond selection, and by treating high-yield as a limited allocation within a broader portfolio rather than a primary position.
Risk warning: CFDs and leveraged forex products are complex instruments and carry a high risk of losing money rapidly due to leverage. Consider whether you understand how these products work and whether you can afford to take the high risk of losing your capital. Check the entity, terms and protections that apply in your jurisdiction before trading. High-yield bonds and bond CFDs involve credit risk, price volatility, and liquidity risk in addition to leverage risk. They are not suitable for all investors. Past default rates and yield spreads are historical data and do not predict future outcomes.
Ready to Compare PU Prime Account Types?
PU Prime is a multi-entity broker — ASIC (Australia) and FSCA (South Africa) regulated entities offer stronger oversight, while most international clients are onboarded to the FSA Seychelles or FSC Mauritius entities. Four account tiers (Cent, Standard, Prime, ECN) range from a $20 minimum deposit to full ECN pricing.
Risk disclaimer: PU Prime is a live, regulated multi-entity broker — trading forex and CFDs is done with real capital under normal market risk (this is not a simulated prop-firm evaluation). PU Prime operates under multiple separate licenses (ASIC, FSCA, FSA Seychelles, FSC Mauritius); which entity holds your account depends on your country of residence and determines your leverage cap and protections — confirm this before funding. CFDs and leveraged forex products are complex instruments and carry a high risk of losing money rapidly due to leverage; 62.2% of retail investor accounts lose money when trading CFDs with this provider. Consider whether you understand how CFDs/forex work and whether you can afford the high risk of losing your money. Affiliate disclosure: HNL Growth earns a commission when you open a PU Prime account through links on this page.