Keltner Channel Explained: Settings and Strategy
A Keltner Channel is a volatility-based indicator made of three lines: a centerline exponential moving average (EMA) and two outer bands set a multiple of the Average True Range (ATR) away from it....
Reviewed using our forex & CFD broker review methodology
Checked on: 2026-08-17 | Broker terms, regulation, and pricing can change. Always verify at the official PU Prime site before opening an account.
Affiliate Disclosure: HNL Growth may earn a commission if you open an account through our links, at no additional cost to you. Risk Warning: CFDs and leveraged forex products are complex instruments and carry a high risk of losing money rapidly due to leverage. 62.2% of retail investor accounts lose money when trading CFDs with this provider. Trading forex and CFDs may not be suitable for all investors. Consider your objectives, experience, and risk appetite before trading, and ensure you understand the risks involved. Broker Disclosure: PU Prime is a live, regulated multi-entity broker (not a simulated prop-firm evaluation) — trades are executed with real capital in live market conditions, subject to normal market risk. Which PU Prime entity holds your account depends on your country of residence and determines your leverage cap and protections.
Last verified: August 2026 | Editorial Team
Keltner Channel Explained: Settings and Strategy
A Keltner Channel is a volatility-based indicator made of three lines: a centerline exponential moving average (EMA) and two outer bands set a multiple of the Average True Range (ATR) away from it. The default setup most platforms load is a 20-period EMA with a 2x ATR multiplier. Because the bands are built from ATR rather than standard deviation, they widen and narrow with actual price volatility, giving beginners a simple visual reference for trend direction, volatility changes, and how far price has stretched from its recent average. It is a context tool, not a signal that predicts where price goes next.
This guide walks through the mechanics with a worked example, common settings for different trading styles, the main risks, and how to practise safely before using real money.
What the Keltner Channel Is, in Plain Terms
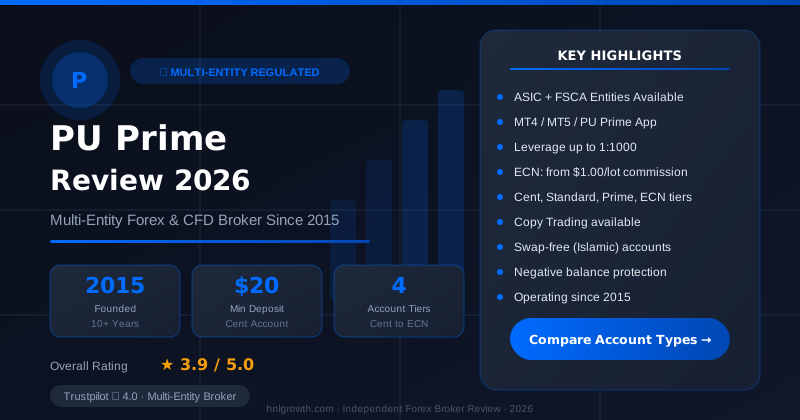
PU Prime — Multi-Entity Forex & CFD Broker
ASIC (AU) + FSCA (ZA) entities available · $20 min deposit (Cent) · MT4, MT5, PU Prime App · 4 account tiers
Picture a moving average with a cushion on either side. The cushion is not a fixed number of pips or points, it stretches and shrinks based on how much the market has actually been moving. That is the entire idea behind a Keltner Channel.
The indicator has three components:
- Centerline: an EMA, most commonly calculated on the closing price. This tracks the underlying trend direction.
- Upper band: the EMA plus (ATR x multiplier).
- Lower band: the EMA minus (ATR x multiplier).
The EMA gives you the "average" price level. The ATR measures recent volatility, meaning how large price swings have been, including gaps and wide intraday ranges. Multiply the ATR by a chosen factor, typically 2, and you get the distance from the centerline to each band.
The indicator is commonly attributed to Chester Keltner in the 1960s, with the ATR-based version popularized later and often associated with trader Linda Raschke. That history is widely repeated across trading education sources, but it is not something this article can independently verify, so treat it as commonly cited background rather than confirmed fact.
Why does this matter for a beginner? Because unlike a fixed price channel, a Keltner Channel adapts. When the market gets choppier, the bands widen automatically. When things calm down, they tighten. That single feature is why it shows up so often in trend and breakout discussions.
How It Works: EMA, ATR, and a Worked Example
The formula, written simply, is:
- Centerline = EMA(close, period)
- Upper band = Centerline + (ATR(period) x multiplier)
- Lower band = Centerline - (ATR(period) x multiplier)
Why ATR instead of standard deviation?
Bollinger Bands, a related and frequently compared indicator, use standard deviation to set band width. Standard deviation reacts sharply to sudden price spikes because it measures how far prices deviate from their average. ATR instead averages the true range (the greatest of: current high minus low, high minus previous close, or low minus previous close) over a period, which tends to produce a smoother, less jumpy band width. Neither calculation method is objectively better, they simply respond to volatility differently. This is a mechanical distinction, not a performance claim.
A step-by-step numeric example
Assume you are looking at a 20-period EMA and 14-period ATR on a daily chart, using the common 2x multiplier.
Suppose at the close of a given session:
- 20-period EMA = 1.0850 (a hypothetical EUR/USD level)
- 14-period ATR = 0.0045 (45 pips of average daily range)
- Multiplier = 2
The bands would sit at:
- Upper band = 1.0850 + (0.0045 x 2) = 1.0850 + 0.0090 = 1.0940
- Lower band = 1.0850 - (0.0045 x 2) = 1.0850 - 0.0090 = 1.0760
If price closes at 1.0955, that is a close outside the upper band, above the 1.0940 level calculated here. On its own, this simply tells you price has moved further from its recent average than is typical given current volatility. It does not tell you whether that move will continue or reverse. If ATR then rises to 0.0060 because volatility picks up, the upper band would recalculate to 1.0850 + 0.0120 = 1.0970, widening automatically without you changing any setting.
This example uses illustrative figures to demonstrate the arithmetic. Actual EMA and ATR values depend on real historical price data on your chosen instrument and timeframe.
Common parameter starting points
These are widely used starting points, not optimized or guaranteed settings. Traders typically adjust from here based on the instrument and timeframe.
| Trading style | EMA period | ATR multiplier | Typical use case |
|---|---|---|---|
| Default / general use | 20 | 2.0 | Balanced setting across most timeframes and markets |
| Scalping / intraday (5-15 min charts) | 10-15 | 1.5-2.0 | Faster reaction to short-term price swings, more frequent band touches |
| Swing trading (4H-daily charts) | 40-50 | 2.0-2.5 | Smoother line, filters short-term noise, fewer but slower signals |
A shorter EMA and tighter multiplier make the channel more sensitive, which produces more signals but also more false ones in choppy markets. A longer EMA and wider multiplier smooth things out but react more slowly to genuine shifts.
What the Bands Can and Can't Tell You
The Keltner Channel gives you three practical readings, each with a real limitation attached.
Trend bias. In a sustained uptrend, price often hugs or repeatedly touches the upper band, that is a sign of trend strength rather than an automatic "overbought" warning. The same applies in reverse for downtrends against the lower band. The limitation: this is a description of what has been happening, not a forecast of what happens next.
Volatility expansion and contraction (the squeeze). When the channel narrows unusually, it reflects a period of low volatility. Traders often watch for this because quiet periods don't tend to last indefinitely. The limitation: a tight channel says conditions may be building toward a bigger move, it does not say which direction that move will take, and there is no guaranteed timeline.
Stretch and mean reversion context. When price pushes well outside a band and then stalls, some traders read that as short-term exhaustion. The limitation is important here: the Keltner Channel does not call tops or bottoms. A market can stay extended for longer than expected, particularly in a strong trend, and treating a single band touch as a reversal signal is one of the more common ways beginners misuse this tool.
| Band behaviour | Common interpretation in trending conditions | Common interpretation in choppy/ranging conditions |
|---|---|---|
| Price hugs one band repeatedly | Often read as trend strength continuing | Often just oscillation, less meaningful |
| Single close outside a band | Treated as somewhat stronger evidence than an intrabar wick, still not a signal on its own | More prone to snapping back, higher false-signal risk |
| Channel narrows sharply (squeeze) | May precede a larger directional move, direction unconfirmed | Can also just reflect a genuinely quiet, directionless market |
Who the Keltner Channel is not for
This indicator is not well suited to traders looking for a single, standalone entry and exit signal. It performs less predictably in tight, sideways, low-volatility ranges, where band touches happen frequently but carry little directional meaning, and it can lag or mislead right after sharp reversals, since the ATR component takes time to catch up with a sudden change in volatility. If you want a tool that gives clean yes/no trade signals, this is not it. It works better as one input alongside price structure, trend context, and a risk management plan than as the sole basis for a decision.
Common Mistakes Beginners Make with Keltner Channel Settings
A few patterns account for most of the frustration beginners run into with this indicator:
- Treating every band touch as a trade signal. In a strong trend, price can ride the band for extended periods. Reacting to every touch without checking the broader trend context leads to premature exits or entries against the trend.
- Assuming a squeeze predicts direction. A narrowing channel flags that volatility is low, it says nothing about whether the eventual move will be up or down.
- Ignoring the wider market picture. The channel describes price relative to its own recent average and volatility. It does not account for news events, session changes, or support and resistance levels that might be more relevant to the move you're watching.
- Constantly changing the settings. Switching between EMA periods and multipliers after a few losing signals makes it difficult to build any real understanding of what the indicator is telling you on a given instrument. Most traders who use it successfully pick a setting, test it on historical data, and stay consistent long enough to judge it fairly.
- Using it in isolation. Because ATR-based bands are smoother than standard-deviation bands, some beginners assume that smoothness means reliability. It reduces noise, it does not add predictive power on its own.
How to Practise Keltner Channel Trading on a Demo Account
Before applying any of this with real capital, it is worth rehearsing on a demo account, where you can add the indicator, adjust the EMA period and ATR multiplier, and watch how the bands behave across different market conditions without financial risk.
A practical sequence for practising:
- Open a demo account and add the Keltner Channel indicator to your chart from your platform's indicator list.
- Start with the default 20 EMA / 2x ATR setting and observe how the bands react on a few different instruments and timeframes.
- Note down instances where price closes outside a band, and separately track what happens over the following sessions, without acting on assumptions.
- Try adjusting the EMA period shorter for an intraday chart and longer for a daily chart, and compare how signal frequency changes.
- Combine your Keltner Channel reading with basic trend and support/resistance context before deciding whether a setup looks worth acting on, even in the demo environment.
Disclosure: This page may contain affiliate links. We may earn a commission if you open an account through our links, at no extra cost to you.
Practising settings on a demo account first, before committing real funds, is a reasonable way to get comfortable with how the indicator behaves on the instruments you actually plan to trade. Open a PU Prime demo account to test different Keltner Channel settings under live market prices without risking capital, following the account setup steps on that page.
FAQ
Why use ATR instead of standard deviation for the bands? ATR measures the average size of recent price ranges, including gaps, while standard deviation measures how far prices deviate from their average. In practice, ATR-based bands tend to react a little more smoothly to sudden volatility spikes than standard-deviation-based bands. This is a calculation difference, not evidence that one produces better trading results.
What settings should I use for day trading versus swing trading? There is no universally optimal setting. Shorter EMA periods (roughly 10-15) with a similar or slightly tighter ATR multiplier are common starting points for intraday charts, since they react faster to short-term price changes. Longer EMA periods (roughly 40-50) are more common on daily or multi-day charts, where traders prioritize filtering noise over catching every short-term wiggle. Test any setting on historical data before relying on it.
How is a Keltner Channel different from Bollinger Bands? Both indicators plot bands around a moving average, but they calculate width differently: Keltner Channels use ATR, Bollinger Bands use standard deviation. This tends to make Keltner Channels react a bit more smoothly and Bollinger Bands a bit more sensitive to sudden price spikes. Neither is inherently superior, traders choose based on which reading style suits their strategy, and many compare both before settling on one. If you see a claim about one indicator having a specific win rate over the other, treat it with caution unless it comes with a transparent, verifiable backtest, since indicator performance varies heavily by instrument, timeframe, and market regime.
Can I use Keltner Channels on forex, stocks, and other assets? The calculation itself works on any instrument with regular price and volatility data, including forex pairs, indices, commodities, and shares. How well it performs as a decision-support tool varies by instrument because volatility behaviour differs across asset classes. If you are trading through PU Prime, exact spreads and costs by instrument and account type are listed on the PU Prime spreads and costs page, and values there are noted as reference only, so check your trading platform for the most current figures.
Does a band breakout mean the trend will continue? Not necessarily. A close outside a band can reflect genuine trend strength, or it can be a short-term overextension that stalls. The Keltner Channel gives you information about how far price has moved relative to its recent average and volatility, it does not forecast what happens next. Combining it with broader trend context and risk management is generally more useful than reacting to a single band close.
What should I check before trading live with this indicator? A few things worth verifying yourself rather than assuming: which platform you're using and whether the Keltner Channel is available natively or needs to be added from an indicator library, how the instrument's typical spread and any commissions affect your entry and exit levels near the bands, and whether the account type and regulatory entity you'd be trading under fit your jurisdiction. For PU Prime specifically, regulatory coverage differs by entity and jurisdiction, so review the PU Prime regulation page for the specific authority relevant to your location before opening a live account.
What This Page Doesn't Cover
This guide focuses on the mechanics, default settings, and basic signal reading for the Keltner Channel as a standalone concept. It does not cover full multi-indicator trading systems, automated or algorithmic strategies built around the channel, or asset-class-by-asset-class breakdowns of how volatility behaves differently across forex, equities, and commodities. Those are broader topics better suited to dedicated strategy or platform guides.
Risk Warning
Risk warning: CFDs and leveraged forex products are complex instruments and carry a high risk of losing money rapidly due to leverage. Consider whether you understand how these products work and whether you can afford to take the high risk of losing your capital. Check the entity, terms and protections that apply in your jurisdiction before trading. Indicators like the Keltner Channel describe historical price and volatility behaviour, they do not predict future outcomes, and no indicator or strategy can guarantee profits or eliminate the risk of loss.
Ready to Compare PU Prime Account Types?
PU Prime is a multi-entity broker — ASIC (Australia) and FSCA (South Africa) regulated entities offer stronger oversight, while most international clients are onboarded to the FSA Seychelles or FSC Mauritius entities. Four account tiers (Cent, Standard, Prime, ECN) range from a $20 minimum deposit to full ECN pricing.
Risk disclaimer: PU Prime is a live, regulated multi-entity broker — trading forex and CFDs is done with real capital under normal market risk (this is not a simulated prop-firm evaluation). PU Prime operates under multiple separate licenses (ASIC, FSCA, FSA Seychelles, FSC Mauritius); which entity holds your account depends on your country of residence and determines your leverage cap and protections — confirm this before funding. CFDs and leveraged forex products are complex instruments and carry a high risk of losing money rapidly due to leverage; 62.2% of retail investor accounts lose money when trading CFDs with this provider. Consider whether you understand how CFDs/forex work and whether you can afford the high risk of losing your money. Affiliate disclosure: HNL Growth earns a commission when you open a PU Prime account through links on this page.