Natural Gas Prices Explained: What Drives Them and How to Trade
Natural gas is a globally traded energy commodity priced at physical delivery hubs — the most important being Henry Hub in Louisiana (quoted in USD per MMBtu), the UK National Balancing Point (NBP,...
Reviewed using our forex & CFD broker review methodology
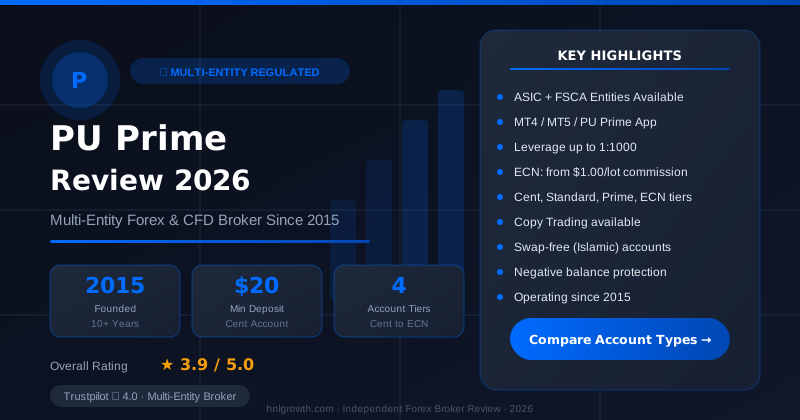
Checked on: 2026-08-17 | Broker terms, regulation, and pricing can change. Always verify at the official PU Prime site before opening an account.
Affiliate Disclosure: HNL Growth may earn a commission if you open an account through our links, at no additional cost to you. Risk Warning: CFDs and leveraged forex products are complex instruments and carry a high risk of losing money rapidly due to leverage. 62.2% of retail investor accounts lose money when trading CFDs with this provider. Trading forex and CFDs may not be suitable for all investors. Consider your objectives, experience, and risk appetite before trading, and ensure you understand the risks involved. Broker Disclosure: PU Prime is a live, regulated multi-entity broker (not a simulated prop-firm evaluation) — trades are executed with real capital in live market conditions, subject to normal market risk. Which PU Prime entity holds your account depends on your country of residence and determines your leverage cap and protections.
Last verified: August 2026 | Editorial Team
Natural Gas Prices Explained: What Drives Them and How to Trade
Natural gas is a globally traded energy commodity priced at physical delivery hubs — the most important being Henry Hub in Louisiana (quoted in USD per MMBtu), the UK National Balancing Point (NBP, quoted in GBp per therm), and the Dutch Title Transfer Facility (TTF, quoted in EUR per MWh). Prices at these hubs are set continuously by supply and demand, making them distinct from — and often disconnected from — the gas bill a household receives. For traders, natural gas CFDs and NYMEX futures offer direct exposure to hub price movements without physical delivery. Understanding what drives those movements — storage cycles, LNG flows, weather demand, and geopolitics — is the starting point for trading the commodity intelligently.
What Natural Gas Prices Actually Measure
PU Prime — Multi-Entity Forex & CFD Broker
ASIC (AU) + FSCA (ZA) entities available · $20 min deposit (Cent) · MT4, MT5, PU Prime App · 4 account tiers
When a financial headline says "natural gas is up 4%," it is almost always referring to the NYMEX Henry Hub front-month futures contract, the global benchmark for US natural gas priced in USD per MMBtu (million British thermal units).
The UK equivalent is NBP, quoted in GBp per therm (100,000 BTU). Europe's primary benchmark is TTF, quoted in EUR per MWh. Because these units differ, direct comparisons require conversion: 1 MMBtu ≈ 10 therms ≈ 293 kWh. When Henry Hub trades at 2.50 USD/MMBtu, that is roughly equivalent to 25 USD/therm or 8.5 USD/MWh in raw commodity terms — before transport, taxes, or retail margin are added.
These hub prices represent the wholesale commodity. What a household pays for gas is something else entirely: the commodity price plus transmission and distribution charges, retailer margin, and government taxes. In the UK and EU, those add-ons can represent a substantial share of the final bill. This article focuses on the commodity price — the part that moves on trading charts — not on energy bill comparison.
Indicative benchmark snapshot (illustrative — see live chart for current figures)
| Hub | Region | Unit | Quoted currency | Approx. unit conversion |
|---|---|---|---|---|
| Henry Hub | United States | USD/MMBtu | USD | 1 MMBtu ≈ 10 therms ≈ 293 kWh |
| NBP | United Kingdom | GBp/therm | British pence | 1 therm ≈ 0.1 MMBtu ≈ 29.3 kWh |
| TTF | Netherlands / EU | EUR/MWh | Euro | 1 MWh ≈ 3.41 MMBtu |
Prices move continuously. Always check a live data source (e.g., CME Group or Investing.com) for current figures. Do not use this table as a current price reference.
Five Forces That Move the Price
Natural gas does not move on one driver alone. The table below ranks the five most impactful forces by typical magnitude and how quickly each feeds into prices.
Price driver priority matrix
| Driver | Category | Typical price impact | Speed of effect | Directional context (mid-2026) |
|---|---|---|---|---|
| EIA storage vs 5-year average | Supply/Inventory | High | Same session (Thursdays) | Seasonal — significance peaks Oct–Mar |
| Winter/summer weather demand | Demand | High | 1–5 trading sessions | Seasonal — peaks Nov–Feb and Jul–Aug |
| LNG export volume | Supply | Medium–High | Days to weeks | Structurally rising (US capacity additions ongoing) |
| Hurricane / production disruption | Supply shock | High (tail risk) | Minutes to hours | Seasonal — Gulf of Mexico Jun–Nov |
| USD index movement | Macro | Low–Medium | Same session | Inverse correlation; commodity-wide |
| European supply security events | Geopolitical | Medium–High | Hours to days | Risk elevated since 2022; monitor for change |
Directional context column reflects general market background as of mid-2026. It describes structural or seasonal conditions, not price forecasts. Verify current conditions before trading.
1. Storage Inventories vs the Five-Year Average
The US Energy Information Administration (EIA) publishes its Weekly Natural Gas Storage Report every Thursday at 10:30 a.m. Eastern Time. The report is subject to federal holiday schedule adjustments — check the EIA release calendar at eia.gov before each trading week to confirm the exact date and time of the upcoming release.
The number that matters is not the absolute storage level — it is the deviation from the five-year average. A storage surplus suggests supply is comfortable and typically pressures prices lower. A deficit, particularly heading into winter, signals potential tightness and supports higher prices. This single release is the most reliably price-moving scheduled event in the natural gas calendar.
2. LNG Export Demand and Terminal Flows
The United States became the world's largest LNG exporter, and US export terminal utilisation directly competes with domestic gas supply. When export terminals run at high capacity, more gas leaves the domestic market, tightening supply and supporting Henry Hub prices. Traders track daily LNG feed gas flows reported by pipeline data providers as a leading indicator.
3. Weather-Driven Demand Peaks
Extreme cold raises heating demand; extreme heat raises cooling demand (power plants burn gas to generate electricity for air conditioning). Both can draw down storage rapidly. In practice, weather is the hardest driver to forecast beyond a two-week window — which means price moves on weather revisions can be sharp and sudden.
4. Hurricane and Production Disruptions
Gulf of Mexico production accounts for a meaningful share of US gas output. A Category 3+ hurricane tracking through the Gulf can cause platforms to shut in production for days or weeks, creating an immediate supply shock. Markets begin pricing this risk during tropical storm formation, often before a landfall.
5. Geopolitical Supply Risk
European buyers learned in 2022 that infrastructure dependency creates price vulnerability when supply is disrupted. The TTF price spiked to multi-decade highs as Europe scrambled for LNG alternatives. While Henry Hub was less directly affected, the global LNG arbitrage market means European demand changes do feed back into US export volumes and, eventually, US prices. The degree to which this risk remains active or dormant changes over time; check current market commentary for the latest assessment before trading.
Why US and European Prices Tell Different Stories
Henry Hub and TTF can diverge by multiples rather than percentages. In early 2023, TTF was trading at more than five times the Henry Hub equivalent price. The structural reasons:
- Infrastructure: The US has a vast domestic pipeline network that keeps gas cost-efficient across regions. Europe relies partly on pipeline imports and partly on LNG regasification terminals — the latter requiring liquefaction, shipping, and regasification, each adding cost.
- LNG arbitrage windows: When the TTF/Henry Hub spread is wide enough to cover LNG supply-chain costs (liquefaction, shipping, regasification), export volumes increase. This arbitrage tends to narrow the spread over weeks to months, but not instantaneously. The specific cost components vary with market conditions and should be verified from current industry sources before use in any trading analysis.
- Regulatory and tax differences: European gas prices include EU Emissions Trading Scheme costs and higher state levies. These do not affect commodity trading prices directly, but they affect the end-consumer cost that drives political pressure on supply security.
- Domestic production buffer: The US Permian and Marcellus shale basins give Henry Hub a structural production floor. Europe has limited domestic production, making it more exposed to import disruption.
For traders: a natural gas CFD on a platform like PU Prime tracks Henry Hub. Understanding the Henry Hub / TTF divergence matters primarily for context — if European demand is extremely strong, it can pull US LNG exports up and support Henry Hub prices from the demand side.
The Seasonal Cycle Every Natural Gas Trader Should Know
Natural gas consumption follows a repeating annual pattern, and the price often reflects that cycle weeks in advance.
Seasonal volatility calendar (historical tendency — not a guarantee of future behaviour)
| Quarter | Typical market phase | Historical volatility tendency | Key event to watch |
|---|---|---|---|
| Jan–Mar | Peak withdrawal season | High — cold snaps can accelerate storage draws sharply | EIA weekly draws vs weather forecasts; polar vortex risk |
| Apr–Jun | Injection season begins | Low-to-moderate — market often consolidates as storage refills | Storage refill rate; LNG export pace; spring weather normalisation |
| Jul–Sep | Summer cooling demand + hurricane season | Moderate-to-high — heat waves and Gulf storms are wildcard events | Power-sector demand; tropical storm formation in the Gulf |
| Oct–Dec | Pre-winter positioning + early withdrawal | Rising — market prices in winter risk premium ahead of schedule | Early cold snaps; storage adequacy vs winter demand projections |
Historical tendency based on seasonal patterns in NYMEX front-month natural gas. Past seasonal patterns do not guarantee future price behaviour.
The injection season (roughly April–October) is when gas flows into underground storage to build the reserve for winter. The withdrawal season (November–March) drains that reserve. Prices tend to be most volatile when the trajectory of storage build or draw diverges unexpectedly from the five-year average — which is why the Thursday EIA report carries outsized weight during both transition periods.
How to Trade Natural Gas: Instruments and Mechanics
Three main instruments give retail traders exposure to natural gas price moves.
Instrument comparison
| Instrument | Approximate minimum size | Leverage | Overnight cost | Physical delivery | Best suited for |
|---|---|---|---|---|---|
| NYMEX futures (NG) | 10,000 MMBtu per contract | Exchange-set margin; verify at CME Group* | No direct swap; roll cost on expiry | Yes — must close before delivery | Experienced traders, larger positions, hedgers |
| Natural gas CFD (PU Prime) | Verify at puprime.com/spread-and-costs† | Varies by account type and jurisdiction | Swap charge applies (long and short — see note below)† | No physical delivery | Short-to-medium term retail traders |
| Natural gas ETF (e.g., UNG) | 1 share (approximate range — verify current NAV)* | None (unleveraged; leveraged variants exist separately) | Management fee (TER); roll cost embedded | No | Investors seeking commodity exposure without leverage |
Futures margin and ETF NAV are approximate references; verify current figures independently before trading. †PU Prime CFD contract size, spread, and swap rates must be verified at the official spread-and-costs page before placing any trade. Note on swap costs: overnight swap charges typically apply to long positions on commodity CFDs; short positions may attract a swap credit or charge depending on the instrument and current rate environment. Check the current rates for both directions on the spread-and-costs page.
Worked CFD Trade Example (Illustrative Only)
This example uses round-number figures to demonstrate the mechanics. It is not based on live market data and does not represent a typical or guaranteed outcome.
Scenario: Henry Hub price moves from 2.50 to 3.20 USD/MMBtu — a 70-cent / 28% rise.
Assume a trader holds 1 natural gas CFD lot long from entry at 2.50.
| Variable | Illustrative value | Note |
|---|---|---|
| Entry price | 2.500 USD/MMBtu | Hypothetical |
| Exit price | 3.200 USD/MMBtu | Hypothetical |
| Price move | +0.700 USD (+28%) | Gross move before costs |
| Contract size | Verify at puprime.com/spread-and-costs | Use official figure only |
| Gross profit per contract | Contract size × 0.700 | Requires official contract size to calculate |
| Spread cost | Verify at puprime.com/spread-and-costs | Deducted on entry |
| Overnight swap (long) | Verify at puprime.com/spread-and-costs | Accrues daily if held overnight; can be positive or negative for short positions |
| Margin required | Depends on leverage tier and jurisdiction | Check account conditions |
If the price falls 10% instead (2.50 → 2.25): the loss equals contract size × 0.25 USD. With leverage, this loss is realised against the margin deposit, not the full notional value — which is precisely why leverage amplifies risk as well as potential return.
Before using this calculation framework with real numbers, verify the exact PU Prime natural gas contract size, typical spread, and current swap rates for both long and short positions at puprime.com/spread-and-costs. The figures the platform displays are authoritative; figures in this article are illustrative only and are subject to change.
Disclosure: This page may contain affiliate links. We may earn a commission if you open an account through our links, at no extra cost to you.
Ready to apply what you've just read? Open a PU Prime demo account and practise natural gas trading with real market prices before risking real capital.
Reading Price Signals: From News Headline to Chart Move
The most watched scheduled data release for natural gas traders is the EIA Weekly Natural Gas Storage Report, published every Thursday at 10:30 a.m. Eastern Time. This schedule is subject to federal holiday adjustments — always check the EIA release calendar at eia.gov at the start of each trading week to confirm exact release dates and times. Do not assume the standard Thursday schedule applies without checking.
Here is how the release typically flows through to price:
Pre-release: Analysts publish a consensus estimate for the week's storage change (injection or withdrawal, measured in billion cubic feet / Bcf). Futures markets price in the expected number ahead of the release.
Release at 10:30 ET: The actual figure is published on EIA.gov. If the actual withdrawal is larger than the consensus (less gas in storage than expected), this is a bullish surprise — supply appears tighter. If the build is larger than expected, it is bearish — supply is more comfortable.
Price reaction: NYMEX futures and CFDs tracking Henry Hub typically react within seconds to minutes. A significant miss versus consensus can move price materially within the same session. The size of the reaction depends on the magnitude of the surprise, the season, and the current surplus or deficit versus the five-year average.
Context matters: A bullish storage number in October (pre-winter) carries more weight than the same number in May (mid-injection season). Always combine the reported figure with the seasonal context and the current surplus or deficit versus the five-year average.
What to verify yourself: Check the EIA release calendar at eia.gov before your first trade week to confirm exact release dates, including any holiday adjustments.
Common Mistakes New Natural Gas Traders Make
Ignoring storage data entirely. Some beginners focus only on price charts without tracking the underlying supply-demand context. Natural gas has a scheduled catalyst every Thursday that can move price significantly — trading without awareness of it is trading blind.
Holding through the storage release without a plan. The 10:30 ET release is a high-volatility moment. Traders who hold open positions into the release without a pre-defined exit plan can be caught by a rapid multi-percent move before they can react. Decide your approach before the release, not after.
Confusing retail gas bill movements with commodity price direction. Your household energy bill reflects commodity price plus a chain of mark-ups, taxes, and contract lags. Henry Hub falling 20% does not mean your gas bill falls 20% next month. These are separate markets for separate audiences.
Over-leveraging in high-volatility months. The seasonal calendar above shows that Q1 and Q4 carry historically elevated volatility. Using maximum available leverage during a potential polar vortex event, or during Gulf hurricane season, concentrates risk at the worst possible time.
Treating forecasts as reliable. Natural gas is one of the hardest commodities to forecast precisely because weather — inherently unpredictable beyond 2–3 weeks — is the dominant short-term driver. Analyst price targets for natural gas carry wider uncertainty intervals than most commodities.
Overlooking swap costs on multi-day positions. Holding a CFD position overnight incurs a swap charge (or credit for short positions, depending on the current rate). On a high-leverage position held over several days or weeks, these costs can become material. Always check current swap rates on the PU Prime spread-and-costs page before planning a position that will run across multiple sessions.
Gas Price Outlook: What Analysts Are Watching
Natural gas price forecasts carry higher-than-average uncertainty relative to most financial assets. Weather dependency means that a single abnormal winter or unexpected heat wave can invalidate a 12-month forecast within weeks.
The structural factors analysts monitor as directional inputs (as of mid-2026):
- US LNG export capacity additions: New liquefaction terminals coming online increase the export demand draw on Henry Hub, providing a structural demand floor compared to the pre-export era.
- European storage adequacy: Post-2022, European buyers prioritised storage build aggressively. A well-stocked European storage system reduces LNG import urgency and narrows the arbitrage that has supported US prices.
- Permian Basin associated gas growth: Continued US oil production growth brings associated natural gas as a by-product, adding supply and potentially capping upside at Henry Hub.
- Electrification of heating: A long-run structural demand drag that is measured in decades, not quarters.
What this means in practice: Analysts typically present natural gas forecasts as a range rather than a point estimate. Treat any single-point forecast with scepticism. The scenario that matters most for your trading plan is not the consensus — it is the tail risk in each direction.
Practise on a Demo Before You Commit Capital
Natural gas is an above-average volatility commodity, and the mechanics of CFD trading — margin, leverage, overnight swap costs, and the behaviour of price around data releases — are best understood through practice rather than theory alone.
PU Prime offers a demo account that uses real market prices and real spreads, with no financial risk. You can open positions, observe how price responds to the Thursday EIA storage release, check margin requirements in real time, and build familiarity with the platform before any real capital is involved.
According to PU Prime's official account opening page, the minimum deposit for a live Standard account is $50; the Cent account starts at $20. These minimums apply to the account types described on that page — confirm whether regional variations apply to your jurisdiction before opening an account.
PU Prime states on its regulation page that it operates under the oversight of multiple financial authorities, including the Financial Services Authority of Seychelles (FSA), the Financial Services Commission of Mauritius (FSC), the Financial Sector Conduct Authority of South Africa (FSCA), and the Capital Market Authority of the UAE (CMA). However, the regulation page does not specify on its public excerpt which legal entity covers each jurisdiction. Confirm which entity and which set of regulatory protections apply in your country before opening any account. Full regulatory details are available at puprime.com/regulation.
Open a PU Prime demo and place your first natural gas trade — real market prices, no real money required.
FAQ
What is the current Henry Hub price? Henry Hub prices change continuously during trading hours. For the current price, check CME Group (cmegroup.com), EIA.gov, or your broker's live chart. Any figure published in an article would be outdated by the time you read it.
What moves natural gas prices the most? In the short term, the EIA weekly storage report and weather forecasts are the highest-impact drivers. A storage withdrawal significantly above analyst consensus, combined with a forecast of prolonged cold, is historically the combination most likely to produce a sharp price spike.
Is natural gas more volatile than oil? Generally yes, on a percentage basis. Natural gas tends to have lower liquidity than crude oil and is more sensitive to weather events that can shift demand by large amounts over short periods. This characteristic makes it important to size positions carefully and be aware of the timing of scheduled data releases.
How do I trade natural gas CFDs? You need a CFD broker account with access to the instrument. With PU Prime, natural gas CFDs are available under Commodities. You can open a demo account to practise with live prices before committing real capital. Check the spread-and-costs page for contract specifications, current spreads, and swap rates — both long and short — before trading.
What is the best time of year to trade natural gas? There is no universally "best" time. The highest historical volatility — and therefore the largest potential moves in either direction — tends to occur in Q1 (deep winter withdrawal) and Q4 (early withdrawal season with positioning for winter). Higher volatility increases both opportunity and risk. The storage injection season (Q2–Q3) is historically calmer but remains subject to summer heat and hurricane surprises.
Do short natural gas CFD positions earn a swap credit? This depends on the instrument and current rate environment. Short CFD positions may earn a swap credit on some instruments and at some times, while in other conditions a charge applies. Check the current swap rates for both long and short directions on the PU Prime spread-and-costs page before opening any position you plan to hold overnight.
What to Verify Before You Trade
No first-hand platform testing has been conducted for this article. Verify the following independently before opening a position:
- Current natural gas CFD contract size and typical spread — PU Prime spread-and-costs page
- Overnight swap rates for both long and short natural gas CFD positions — same page
- Which PU Prime regulatory entity and protections apply in your jurisdiction — regulation page
- Current EIA storage report release dates for the next four weeks, including any holiday adjustments — eia.gov release calendar
- Current Henry Hub spot or front-month futures price — CME Group or EIA
- Demo account availability and duration policy — account opening page
- Margin requirements for the lot size you intend to trade at your leverage tier
- Whether minimum deposit requirements vary in your jurisdiction
Risk Warning
Risk warning: CFDs and leveraged forex products are complex instruments and carry a high risk of losing money rapidly due to leverage. Consider whether you understand how these products work and whether you can afford to take the high risk of losing your capital. Check the entity, terms and protections that apply in your jurisdiction before trading.
Natural gas is a high-volatility commodity: prices can move sharply around storage data releases, weather events, and geopolitical developments. Past price behaviour and seasonal patterns do not predict future price moves. Full regulatory information is available at puprime.com/regulation.
Ready to Compare PU Prime Account Types?
PU Prime is a multi-entity broker — ASIC (Australia) and FSCA (South Africa) regulated entities offer stronger oversight, while most international clients are onboarded to the FSA Seychelles or FSC Mauritius entities. Four account tiers (Cent, Standard, Prime, ECN) range from a $20 minimum deposit to full ECN pricing.
Risk disclaimer: PU Prime is a live, regulated multi-entity broker — trading forex and CFDs is done with real capital under normal market risk (this is not a simulated prop-firm evaluation). PU Prime operates under multiple separate licenses (ASIC, FSCA, FSA Seychelles, FSC Mauritius); which entity holds your account depends on your country of residence and determines your leverage cap and protections — confirm this before funding. CFDs and leveraged forex products are complex instruments and carry a high risk of losing money rapidly due to leverage; 62.2% of retail investor accounts lose money when trading CFDs with this provider. Consider whether you understand how CFDs/forex work and whether you can afford the high risk of losing your money. Affiliate disclosure: HNL Growth earns a commission when you open a PU Prime account through links on this page.