Risk Management in Trading: Position Size, Stops and Drawdown
The most common reason traders lose more than expected is not a bad strategy — it is an undefined risk framework. Trading risk management is the set of pre-trade calculations that...
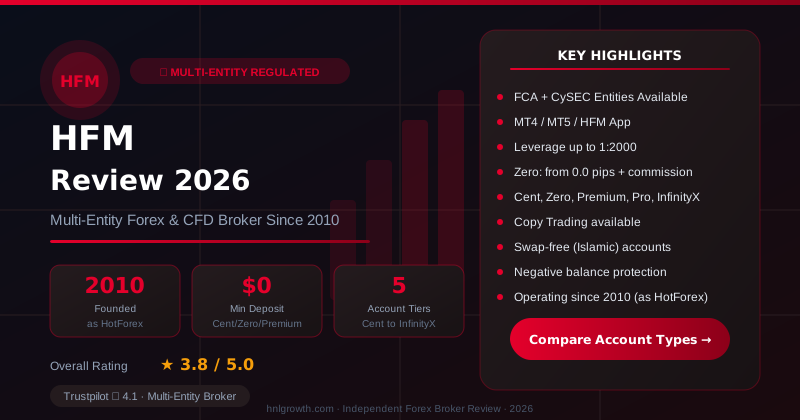
Checked on: 2026-08-06 | Broker terms, regulation, and pricing can change. Always verify at the official HFM site before opening an account.
Affiliate Disclosure: HNL Growth may earn a commission if you open an account through our links, at no additional cost to you. Risk Warning: CFDs and leveraged forex products are complex instruments and carry a high risk of losing money rapidly due to leverage. Between 65-95% of retail investor accounts lose money when trading CFDs, depending on the HFM entity and account type. Trading forex and CFDs may not be suitable for all investors. Consider your objectives, experience, and risk appetite before trading, and ensure you understand the risks involved. Broker Disclosure: HFM (HF Markets Group) is a live, regulated multi-entity broker (not a simulated prop-firm evaluation) — trades are executed with real capital in live market conditions, subject to normal market risk. Protections vary significantly by the specific legal entity that onboards your account.
Risk Management in Trading: Position Size, Stops and Drawdown
The most common reason traders lose more than expected is not a bad strategy — it is an undefined risk framework. Trading risk management is the set of pre-trade calculations that fix how much money is at stake before any position is open. Three mechanical controls govern the outcome: position size (how many units or lots to trade), stop placement (the price at which the trade is wrong), and loss ceilings (daily and drawdown thresholds that trigger a mandatory pause). A fourth variable — the broker's order infrastructure — determines whether those controls execute as planned when the market moves against you. Applied consistently, these four controls mean a losing streak damages your account in a controlled, recoverable way rather than ending it.
The four decisions that exist before every trade is placed
HashHedge — Crypto Futures Prop Firm
Up to $200K funded accounts · 85% profit split · Instant USDT payouts · 160+ assets
Why a sound setup without a loss cap is still a risk failure
A trade with a solid technical signal and no defined exit is not a risk-managed trade. The signal determines whether price is likely to move in one direction. It says nothing about how much you lose when it does not. Risk management answers a different question: what is the most this trade can cost me in dollars, and is that amount consistent with the other trades I plan to take this week?
How position size, stop placement, daily ceiling, and drawdown protocol connect
The four controls form a hierarchy:
- Stop placement defines the price at which the trade idea is invalidated.
- Position size uses that stop distance and your account risk tolerance to produce a specific number of lots.
- Daily ceiling limits total exposure within a session.
- Drawdown protocol triggers a mandatory pause when cumulative losses breach a threshold.
Each layer depends on the one before it. A daily ceiling set in dollars is meaningless if position size is inconsistent trade to trade. A drawdown threshold is meaningless without a hard session stop.
Calculating position size from a fixed dollar loss
The core formula: account risk divided by risk per unit
Position Size (lots) = Account Risk ($)÷ (Stop Distance in Pips × Pip Value per Lot)
For EUR/USD, a standard lot (100,000 units) carries a pip value of approximately $10when the account is denominated in USD. This is a market convention; pip value varies by instrument and account currency.
Worked examples at $5,000, $10,000, and $25,000
All three examples use EUR/USD, a20-pip stop, and 1% account risk:
| Account Size | 1% Risk | Stop (pips) | Pip Value (std lot) | Position Size |
|---|---|---|---|---|
| $5,000 | $50 | 20 | $10 | 0.25 lots |
| $10,000 | $100 | 20 | $10 | 0.50 lots |
| $25,000 | $250 | 20 | $10 | 1.25 lots |
If the stop widens to 40 pips — for example, a GBP/USD trade around a news release — the lot size halves at each account size. Dollar risk stays constant; position size adjusts to maintain it.
The1% and 2% thresholds: The 1% rule is appropriate for accounts under $25,000 and for any strategy with an unproven track record. These are widely cited heuristics, not regulatory standards. Raising to 2% before establishing a documented positive-expectancy strategy accelerates losses during drawdown. The mathematical tension on a small account is real — $10at risk per trade on a $1,000 account limits compounding — but relaxing the rule earlier does not resolve it; it increases the probability of ruin before the strategy can be validated.
How leverage changes margin requirement without changing your dollar risk
Leverage determines how much margin is required to hold a position, not how much you lose if the stop is hit. When position size is calculated correctly from a fixed dollar risk, the dollar loss at the stop is identical regardless of leverage tier.
Table: Leverage-adjusted position sizing —1% risk, 20-pip stop, EUR/USD (rate assumed 1.08)
| Leverage | $5,000 account | $10,000 account | $25,000 account |
|---|---|---|---|
| — | Lots / Margin req. | Lots / Margin req. | Lots / Margin req. |
| 1:10 | 0.25 lots / ~$2,700 | 0.50 lots / ~$5,400 | 1.25 lots / ~$13,500 |
| 1:30 | 0.25 lots / ~$900 | 0.50 lots / ~$1,800 | 1.25 lots / ~$4,500 |
| 1:50 | 0.25 lots / ~$540 | 0.50 lots / ~$1,080 | 1.25 lots / ~$2,700 |
| 1:100 | 0.25 lots / ~$270 | 0.50 lots / ~$540 | 1.25 lots / ~$1,350 |
Dollar risk at the stop: $50 / $100 / $250 respectively — identical across every leverage tier.
The risk enters when traders use higher leverage to open a larger lot size without recalculating dollar risk. That decision multiplies exposure, not just margin efficiency.
Under ESMA product intervention rules, retail clients trading through EU/EEA or UK-regulated entities are subject to a 1:30 maximum on major forex pairs. This applies to the specific regulated entity governing the account; clients of non-EEA entities may face different limits. Check which HFM regulatory entity applies to your account before assuming a leverage tier is available to you.
Disclosure: This page may contain affiliate links. We may earn a commission if you open an account through our links, at no extra cost to you.
Before applying these formulas with real capital, running them in a practice environment first lets you verify the lot-size arithmetic in your specific account currency and instrument.
Practice position sizing on an HFM demo account
Choosing a stop-loss method that matches market structure
Structural stops: placing the exit at the price that invalidates the trade idea
A structural stop is placed just beyond the nearest support level, demand zone, or swing low that the trade thesis depends on. If a long EUR/USD position is based on a bounce from a demand zone at1.0820, the stop belongs below that zone — at the price where the structure is clearly broken, not at a round number above it.
This method produces a stop distance that reflects actual market conditions. It is the preferred method for any account size where the resulting position size remains above the broker minimum.
Volatility-adjusted stops: using average range to avoid noise-triggered exits
Stops placed too close to entry are triggered not by the trade being wrong but by normal intraday noise. Average True Range (ATR), calculated over14 periods, quantifies the average candle movement over that window.
A widely applied rule: set the stop at 1.5–2× the 14-period ATR below entry. If EUR/USD has a 14-period ATR of 60 pips, a 1.5× stop is 90 pips. The position size must be reduced accordingly to maintain dollar risk at1%. ATR widens around news events and narrows in quiet conditions, making this a structurally honest alternative to fixed-pip placement.
Fixed-dollar stops: the limited case where they apply
A fixed-dollar stop is appropriate only when account size is too small for a structural stop to produce a viable position size — for example, a $1,000 account risking1% ($10) where a 20-pip structural stop would require a 0.05-lot position, below many brokers' 0.01-lot minimum. Even in this case, the stop distance has no relationship to where the trade idea is actually wrong. It is a capital management constraint, not a technical one.
Deriving a daily and weekly loss ceiling from your strategy
Estimating expected losing streak from win rate
A daily loss ceiling should reflect the realistic worst-case consecutive-loss sequence for your strategy, not an arbitrary dollar amount. The number of consecutive losses that has a5% probability of occurring follows:
Max Losing Streak ≈ log(0.05) ÷ log(1 − Win Rate)
| Win Rate | Max Streak (5% probability) | Recommended daily cap |
|---|---|---|
| 60% | ~4 losses | 3× per-trade risk % |
| 50% | ~5 losses | 3× per-trade risk % |
| 40% | ~6 losses | 4× per-trade risk % |
If you risk1% per trade at a 50% win rate, a 3% daily cap ends the session after three full-risk losses — well before the low-probability five-loss streak that the formula identifies as the statistical tail.
A practical starting point: daily loss cap of 2–3× your per-trade risk percentage.
How spread and commission shrink effective risk-reward before the trade starts
Broker costs are paid at entry. Every trade therefore begins in a deficit equal to the round-trip transaction cost. On short-timeframe trades with tight stops, that deficit is not trivial.
Break-even target (pips) = Stop Distance + (2× Total Round-Trip Cost)
Minimum viable R:R = Break-even target ÷ Stop Distance
Table: Minimum R:R needed to break even after costs — EUR/USD (indicative,50% win rate assumed)
| Account type (HFM) | Stated spread | 5-pip stop | 10-pip stop | 20-pip stop |
|---|---|---|---|---|
| Premium | From1.4pip (no commission) | ~1.56:1 | ~1.28:1 | ~1.14:1 |
| Zero | From 0 pip on forex + commission | Commission not confirmed in published conditions — verify on HFM trading conditions page | — | — |
| Pro | From 0.6 pip + commission | Commission not confirmed in published conditions — verify on HFM trading conditions page | — | — |
Spread figures are from the published HFM account conditions table and are subject to change. Commission amounts for Zero and Pro accounts were not confirmed in the available official documentation.
The practical implication for the Premium account: a 5-pip stop requires a target of at least 7.8 pips to break even — not 10. Extending the stop to 20 pips reduces cost drag to approximately 14% of intended reward.
A tiered drawdown protocol that removes in-the-moment decisions
Defining three response thresholds and the mandatory action at each
A drawdown protocol must be written before losses occur. Rules revised mid-drawdown have a known failure mode: they are relaxed at the exact moment they matter most.
| Tier | Drawdown (peak-to-trough) | Mandatory action |
|---|---|---|
| Tier 1 | 5% | Reduce position size by 50% for all remaining trades that session |
| Tier 2 | 10% | Stop trading for the session; review trade journal before next session |
| Tier 3 | 15% | Halt trading for the week; complete a formal strategy review before returning |
These thresholds are starting points. A higher-frequency strategy with a 55% win rate may accept a 5% daily drawdown as within normal variance. A swing strategy with wide stops may reach Tier 1 after two trades. Calibrate to your strategy's documented variance, not to a generic rule.
The asymmetric math of recovery: why a 25% loss requires more than a 25% gain
Table: Gain required to recover from drawdown
| Drawdown | Recovery gain required |
|---|---|
| 5% | 5.3% |
| 10% | 11.1% |
| 15% | 17.6% |
| 20% | 25.0% |
| 25% | 33.3% |
| 30% | 42.9% |
| 40% | 66.7% |
| 50% | 100.0% |
A 25% drawdown requires a 33.3% gain from the reduced equity base to reach a new high. The Tier 1 position-size reduction is structurally important because it reduces the denominator: a smaller active account needs a smaller absolute gain to recover, and smaller position sizes mean the strategy can remain operational rather than burning remaining capital.
Combining risk-reward ratio with win rate into a single expectancy number
The expectancy formula and what it reveals about popular ratio targets
Expectancy = (Win Rate × Average Win) − (Loss Rate × Average Loss)
Per dollar risked (where Average Loss = $1):
Expectancy = (Win Rate × R:R ratio) − (1 − Win Rate)
Risk-reward vs. win-rate expectancy matrix
Cells show expectancy in dollars per $1 risked. Bold negative cells indicate a losing system at that combination.
| Win Rate | 1:1 R:R | 1.5:1 R:R | 2:1 R:R | 3:1 R:R |
|---|---|---|---|---|
| 30% | −$0.40 | −$0.25 | −$0.10 | +$0.20 |
| 40% | −$0.20 | $0.00 | +$0.20 | +$0.60 |
| 50% | $0.00 | +$0.25 | +$0.50 | +$1.00 |
| 55% | +$0.10 | +$0.38 | +$0.65 | +$1.20 |
| 60% | +$0.20 | +$0.50 | +$0.80 | +$1.40 |
The 2:1 ratio producesa losing system at a 30% win rate (−$0.10 per dollar risked) and breaks even only marginally above 33%. A 3:1 ratio is the first combination that produces positive expectancy at 30%. Neither a ratio target nor a win rate alone is sufficient — only the combination determines whether a strategy is viable over a series of trades.
Correlated exposure across currency pairs
How two separate trades can function as one oversized position
EUR/USD long and GBP/USD long are both net long USD-short positions. When the 30-day rolling correlation between the two pairs exceeds 0.70, the two trades respond to USD-direction moves as a single combined position. Running both at 1% account risk each does not produce 1% + 1% of independent risk — it produces approximately 2% exposure to a single directional outcome.
USD/JPY long alongside EUR/USD long introduces a partially offsetting element (long USD on both, but JPY and EUR are weakly correlated), but the net USD exposure remains doubled.
A two-step correlation check before adding a second position
- Look up the 30-day rolling correlation between the two pairs. Correlation data is available from most charting platforms. A reading above 0.70 flags the pairs as highly correlated.
- If correlation is above 0.70, treat the combined position as a single trade for daily loss limit purposes. Either reduce each position to 0.5% risk (maintaining your 1% combined ceiling), or close one before opening the other.
This check takes under a minute and prevents a common compounding error where a trader believes they are diversified across four trades but is effectively running a single large directional bet split across separate order tickets.
How broker infrastructure enforces or erodes your risk plan
Negative balance protection and guaranteed stops as a quantifiable risk floor
Negative balance protection (NBP) caps total loss at the deposited amount — your account cannot go below zero due to a gap move or extreme volatility event. Under ESMA rules, NBP is mandatory for retail clients of EU/EEA and UK-regulated entities. This applies only to the specific regulated entity governing the account; clients of HFM's international entity should check the applicable terms for their jurisdiction.
Guaranteed stop-loss orders (GSLOs) go further: they guarantee execution at the stop price regardless of gaps. The cost is a premium, typically a wider spread or fixed fee, paid at the time the order is placed. The case for paying it is strongest on volatile instruments held overnight or over weekends, where gap risk is highest. Whether GSLOs are available on specific HFM instruments and account types is not confirmed in the available official documentation — verify this directly on HFM's trading conditions page before relying on it in your risk plan.
Platform order types that close the gap between planned and actual risk
A stop-loss attached to the order at entry removes the need for a discretionary decision when price reaches the invalidation level. Trailing stops ratchet the stop price upward as a position moves in profit, locking in gains without manual intervention. Both are available on MetaTrader 4 and MetaTrader 5, which HFM supports across all account types according to its published account conditions.
One-click stop attachment at order entry is the single most effective procedural control against the most common execution failure: entering a position without a stop because "I'll set it once the trade moves my way."
Margin call and stop-out levels as a structural limit on worst-case exposure
According to HFM's published account conditions, margin call is triggered at 20% margin level on InfinityX accounts and at 50% on Cent, Zero, Pro, and Premium accounts. The stop-out level — the point at which positions are automatically closed — is 0% for InfinityX and 20% for all other account types. These figures are subject to change; verify the current figures on HFM's trading conditions page and confirm which entity and account type apply to your situation.
These levels function as a structural backstop, not a substitute for a stop-loss. A position closed at stop-out has already suffered losses well beyond the planned risk amount. The stop-loss on each individual trade is the primary control; the stop-out level is the infrastructure floor beneath it.
For account types and further detail on HFM's account structure, see the HFM trading accounts page.
Auditing whether actual risk matched planned risk after each session
The three numbers to compare
Table: Post-session execution gap audit
| Planned | Actual | Gap | |
|---|---|---|---|
| Entry price | Price at order placement | Fill confirmation price | Difference in pips |
| Stop price | Stop-loss order price | Actual execution price (if triggered) | Difference in pips |
| Dollar risk | Calculated at entry | Actual loss if stop hit | Gap as % of planned risk |
Run this check after every session in which a stop was triggered. If dollar risk actual exceeds dollar risk planned by more than 10%, log the cause before the next session.
Common drift patterns and corrective rules
Slippage on news releases: Entry fills beyond the planned price because the spread widens at the moment of execution. Corrective rule: avoid market orders on major economic releases; use limit orders instead.
Manual stop adjustment under pressure: A stop that was planned at a specific structural level is moved further away during the trade because "the setup still looks valid." Corrective rule: once set, a stop can only be moved in the direction of profit, never against it.
Widened spread at market open: The spread at the open of the London or New York session can be 2–5× the average, increasing effective entry cost. Corrective rule: if the spread at intended entry exceeds 20% of planned stop distance, wait for spread normalisation or skip the trade.
Position-size creep after a winning streak: A sequence of winners creates pressure to increase lot size "while the strategy is working." Corrective rule: lot size is calculated from the formula, not from recent P&L. Revisit the base risk percentage only during formal strategy reviews, not between trades.
Frequently asked questions
What is the 1% rule in trading? The 1% rule means risking no more than 1% of account equity on any single trade. It is a widely cited heuristic, not a regulatory requirement. On a $10,000 account, that is $100 per trade. Its primary function is to ensure that a realistic losing streak — six to eight consecutive losses — does not eliminate a meaningful portion of capital.
How do you calculate position size for a forex trade? Divide your account risk in dollars by the product of stop distance in pips and pip value per lot. For EUR/USD with a standard lot pip value of $10: $100 risk ÷ (20 pips × $10) = 0.50 lots. Pip value varies by instrument and account currency.
Where should a stop-loss be placed? At the price that proves the trade idea wrong — below the demand zone or swing low for a long position, above the supply zone or swing high for a short. ATR-based placement (1.5–2× the 14-period ATR) is an alternative when structure is unclear. Fixed-dollar stops should be a last resort on small accounts, not a default method.
What daily loss limit should a beginner use? A starting point is 2–3% of account equity, derived from the expected losing streak for a strategy with a known win rate. When the daily cap is reached, the trading session ends. No exceptions.
Does higher leverage mean higher risk? Only if position size is not recalculated. If you risk 1% of $10,000 ($100) using correct position sizing, the dollar loss at the stop is $100 regardless of whether leverage is 1:10 or 1:100. Leverage changes the margin required to hold the position, not the planned loss. The danger is using available leverage to increase lot size beyond what the formula produces.
What is a good risk-to-reward ratio? There is no universally correct answer. The expectancy matrix above shows that a 2:1 ratio loses money at a 30% win rate and breaks even around 34%. The right ratio is the one that produces positive expectancy when combined with your documented win rate. A 3:1 ratio with a 40% win rate (+$0.60 per dollar risked) is more robust than a 2:1 ratio with a 50% win rate (+$0.50).
Should every trade have a stop-loss? Yes. A position without a stop-loss converts a defined-risk trade into an open-ended liability. The only justification for no stop is a fully hedged position where a separate instrument caps the downside — a complex structure not appropriate for most retail traders.
Risk warning: CFDs and leveraged forex products are complex instruments and carry a high risk of losing money rapidly due to leverage. Consider whether you understand how these products work and whether you can afford to take the high risk of losing your capital. Check the entity, terms and protections that apply in your jurisdiction before trading.
Risk warning: CFDs and leveraged forex products are complex instruments and carry a high risk of losing money rapidly due to leverage. Retail investor accounts lose money when trading CFDs with most providers; the exact percentage varies by HFM entity and account type. You should consider whether you understand how CFDs work and whether you can afford to take the high risk of losing your money. Check the entity, terms and investor protections that apply in your jurisdiction before opening an account or trading.
Ready to Start Your Funded Trading Journey?
Join traders backed by $11M+ in verified payouts and a 4.7/5 Trustpilot rating. Compare HashHedge challenge plans, drawdown rules, and payout terms — apply code ha25 for the current discount.
Risk disclaimer: Challenge fees are non-refundable if you breach the rules. Prop trading involves significant financial risk. Past performance in a simulated environment does not guarantee results on a funded account. Only purchase if you understand the rules fully and can afford to lose the fee. Affiliate disclosure: HNL Growth earns a commission when you purchase a HashHedge challenge through links on this page.