Support and Resistance: How to Draw Levels That Hold
Support and resistance are price zones where buying or selling pressure has repeatedly concentrated, causing price to stall or reverse. Support acts as a floor where demand...
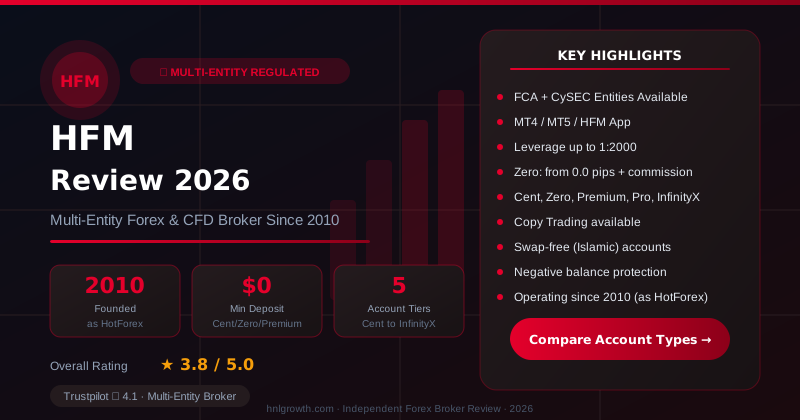
Checked on: 2026-08-05 | Broker terms, regulation, and pricing can change. Always verify at the official HFM site before opening an account.
Affiliate Disclosure: HNL Growth may earn a commission if you open an account through our links, at no additional cost to you. Risk Warning: CFDs and leveraged forex products are complex instruments and carry a high risk of losing money rapidly due to leverage. Between 65-95% of retail investor accounts lose money when trading CFDs, depending on the HFM entity and account type. Trading forex and CFDs may not be suitable for all investors. Consider your objectives, experience, and risk appetite before trading, and ensure you understand the risks involved. Broker Disclosure: HFM (HF Markets Group) is a live, regulated multi-entity broker (not a simulated prop-firm evaluation) — trades are executed with real capital in live market conditions, subject to normal market risk. Protections vary significantly by the specific legal entity that onboards your account.
Support and Resistance: How to Draw Levels That Hold
Support and resistance are price zones where buying or selling pressure has repeatedly concentrated, causing price to stall or reverse. Support acts as a floor where demand absorbs selling; resistance forms a ceiling where supply overwhelms buyers. Traders map these zones using swing points, historical price levels, moving averages, and multi-timeframe analysis, then score each level by touch count, timeframe weight, volume, recency, and confluence to estimate its reliability. Valid levels guide trade entries, stop-loss placement, and profit targets. This guide walks through each identification method, provides a scoring framework to separate strong zones from weak ones, and shows how to translate levels into structured trade plans with defined risk.
The Mechanics Behind Support and Resistance
HashHedge — Crypto Futures Prop Firm
Up to $200K funded accounts · 85% profit split · Instant USDT payouts · 160+ assets
How Buyers and Sellers Create Price Floors and Ceilings
Support forms at a price zone where buyers consistently step in, absorbing selling pressure and preventing further decline. When price drops to this area, demand increases — traders see value, place buy orders, and the downward move stalls or reverses. Resistance works in reverse: sellers concentrate their activity at a ceiling zone, overwhelming demand each time price rises into it.
These zones exist because of an imbalance between supply and demand at specific price levels. A support zone marks where demand has repeatedly exceeded supply. A resistance zone marks the opposite — where supply overwhelms demand.
Why Price Remembers: Participant Memory and Order Clustering
Markets are made of participants who remember prior prices. If EUR/USD reversed sharply at 1.1000 three times in the past year, traders watching that pair will anticipate another reaction when price returns to that area. This collective memory generates order clustering — pending buy or sell orders accumulate near historical turning points, creating self-reinforcing zones.
Round numbers amplify this effect in forex. Levels like 1.1000, 1.2500, or 150.00 in USD/JPY attract disproportionate order flow because institutional desks and retail traders alike anchor their decisions to clean figures. These psychological levels often coincide with technical swing points, adding confluence.
Four Methods to Map Support and Resistance on Any Chart
Swing-Point Mapping: Connecting Peaks and Troughs
Swing points are the most direct way to identify S&R. Open a daily or weekly chart and look for the most visible turning points — where price reversed sharply after making a high or low.
Steps:
- On a daily chart, mark the three to five most obvious swing highs and swing lows from the past six to twelve months.
- Draw horizontal rectangular zones — not thin lines — around each cluster of peaks or troughs.
- Extend those zones to the right edge of the chart to see where they may interact with current price.
- Prioritise levels where multiple swing points cluster within a tight range, indicating repeated rejection.
Swing-point mapping works on every instrument and timeframe, making it the foundation of any S&R workflow.
Historical Price Zones: Prior Reaction Levels
Some levels carry significance because price reacted there multiple times across different periods. Scroll left on your chart and identify price areas where the market reversed or consolidated on at least two separate occasions. The more distinct historical touches a zone has, the stronger the case for a future reaction.
Unlike swing-point mapping, which focuses on recent turning points, historical-zone analysis looks further back — sometimes years — to find levels the market has not forgotten. Previous day, week, and month highs and lows also serve as reference points that short-term traders watch closely.
Dynamic Levels: Moving Averages and Trendlines as Shifting S&R
Not all support and resistance is horizontal. Dynamic levels move with price and time.
Moving averages. The 50-period and 200-period moving averages on a daily chart frequently act as support in uptrends and resistance in downtrends. Because they update with each new candle, they provide a shifting reference that adapts to market conditions. During trending markets, pullbacks to the 50-period average often coincide with trend-continuation entries.
Trendlines. A trendline connects at least two swing lows in an uptrend (acting as rising support) or two swing highs in a downtrend (acting as descending resistance). The more touches a trendline accumulates, the more significant it becomes. Unlike horizontal zones, trendlines slope with the trend and require periodic adjustment as new price data forms.
The key difference: dynamic levels shift every candle. Treat them as moving areas of interest, not fixed barriers.
Cross-Timeframe Layering: Weekly Down to Entry Chart
A level that appears on both the weekly and daily charts carries far more weight than one visible only on a 15-minute chart. Cross-timeframe layering builds a hierarchy of zones, from broad structural levels down to precise entry areas.
Multi-Timeframe S&R Mapping Checklist
| Step | Timeframe | Action | What to Mark | Carry Forward To |
|---|---|---|---|---|
| 1 | Weekly | Identify major swing highs and lows | Two to three dominant S&R zones | Daily chart |
| 2 | Daily | Refine zones, add recent swing points | Clearer boundaries, recent reaction areas | 4-hour chart |
| 3 | 4-Hour | Add intraday levels and trendlines | Shorter-term zones, dynamic levels | 1-hour or 15-min |
| 4 | Entry TF | Finalise entry zones near higher-TF levels | Precise trigger areas for trade execution | Trade plan |
At each step, carry forward only the strongest zones. If a daily level does not align with any weekly zone, note it but assign lower priority.
Disclosure: This page may contain affiliate links. We may earn a commission if you open an account through our links, at no extra cost to you.
S&R Method-to-Style Matcher
| Method | Best Suited For | Ideal Timeframes | Key Strength | Main Limitation |
|---|---|---|---|---|
| Swing-Point Mapping | Swing and position traders | Daily, weekly | Simple, universally applicable | Less precise on lower timeframes |
| Historical Price Zones | All styles | Any | Captures long-term market memory | Older levels may lose relevance |
| Dynamic Levels (MAs, trendlines) | Trend and day traders | 1-hour to daily | Adapts to trending conditions | Generates false signals in ranges |
| Cross-Timeframe Layering | All styles | Weekly to 15-min | Highest conviction through confluence | Requires more analysis time |
Once you know which methods suit your trading style, the next step is ensuring your platform supports the charting tools and timeframes you need. Compare HFM account types and platforms to find the setup that fits your approach.
How Strong Is That Level? A Scoring Framework
Not every line on a chart deserves your attention. The Level Strength Scorecard below scores any S&R zone across five verifiable factors, giving you a quantitative basis to rank levels before committing capital.
Five Factors That Determine Reliability
- Touch count. The number of times price has tested a zone and reversed. More touches suggest stronger participant interest — but a level tested too many times without a decisive break may be weakening as orders get absorbed.
- Timeframe source. Levels from weekly or daily charts carry more weight than those from 15-minute or 5-minute charts, because higher-timeframe data reflects broader participation.
- Volume context. A level where sharp reversals occurred on elevated volume indicates stronger institutional interest than one formed during thin trading.
- Recency. A zone tested within the past few weeks is more likely to influence current participants than one last touched months ago.
- Confluence. When a level aligns with a moving average, trendline, round number, or Fibonacci retracement, the overlapping signals increase the probability of a reaction.
Scoring Walk-Through with a Worked Forex Example
S&R Level Strength Scorecard
| Factor | Weight | Scoring Criteria | Example |
|---|---|---|---|
| Touch count | 30% | 2 touches = 1 pt; 3 touches = 2 pts; 4+ = 3 pts | EUR/USD tested 1.0800 four times → 3 pts |
| Timeframe source | 25% | Intraday = 1 pt; daily = 2 pts; weekly = 3 pts | Level visible on daily chart → 2 pts |
| Volume context | 15% | Low = 1 pt; moderate = 2 pts; high = 3 pts | Reversals on moderate volume → 2 pts |
| Recency | 15% | >6 months = 1 pt; 1–6 months = 2 pts; <1 month = 3 pts | Last test 3 weeks ago → 3 pts |
| Confluence | 15% | None = 0 pts; 1 factor = 1 pt; 2+ factors = 2 pts | 50-day MA overlaps → 1 pt |
Worked example: EUR/USD daily support at 1.0800.
- Touch count: 4 touches → 3 pts × 0.30 = 0.90
- Timeframe: daily → 2 pts × 0.25 = 0.50
- Volume: moderate → 2 pts × 0.15 = 0.30
- Recency: 3 weeks → 3 pts × 0.15 = 0.45
- Confluence: 50-day MA at same area → 1 pt × 0.15 = 0.15
Total: 2.30 out of 3.00 (77%). A strong level worthy of a trade plan. As a guideline, scores above 70% indicate high-conviction zones. Below 40%, the level lacks sufficient evidence — skip the trade or wait for more confirmation.
When Levels Break: Role Reversal and False Breakouts
Why Old Support Becomes New Resistance
When support breaks decisively, it often flips to resistance on any subsequent pullback. The logic is behavioural: traders who bought at support and watched price fall through are now holding losses. When price returns to that zone, they exit at breakeven, creating selling pressure at the former support. The reverse applies when resistance breaks — traders who sold at the ceiling and were wrong look to cover if price revisits, creating demand that turns old resistance into new support.
Role reversal does not happen after every break. Weak levels may simply be forgotten. Focus on levels that scored highly on the scorecard before the break — these carry the strongest flip potential.
Confirming a Genuine Break vs. a Fake-Out
A false breakout occurs when price briefly pushes beyond a level but reverses back inside the range, trapping traders who entered the break. Confirmation criteria for a genuine break include:
- Body close beyond the level. A candle body closing clearly past the zone carries more weight than a wick poking through and retracting.
- Follow-through. At least one additional candle continuing in the breakout direction after the initial close.
- Timeframe confirmation. A break on the daily chart is more meaningful than a break on the 15-minute chart.
- Retest rejection. Price pulls back to the broken level and is rejected, confirming the role reversal.
If price reverses back through the level after a suspected break, treat it as a false breakout — and be aware that failed breaks often trigger sharp moves in the opposite direction as trapped traders exit.
Three Ways to Trade Support and Resistance
Range Trading: Buying the Floor, Selling the Ceiling
When price oscillates between clear support and resistance, range trading offers a structured approach. Buy near support with a stop-loss below the zone; sell near resistance with a stop above. Confirm each entry with a candlestick reversal signal — such as a pin bar or engulfing pattern — at the zone before entering. Exit the trade near the opposite boundary. Range trading becomes unreliable once the range narrows significantly, often signalling an imminent breakout.
Breakout Trading: Entering on Confirmed Violations
Wait for a confirmed break using the criteria above — body close plus follow-through — then enter in the breakout direction. Place your stop beyond the broken level, which now acts as reversed S&R. Target the next significant zone on the higher timeframe. Breakout entries typically experience higher initial volatility, so position sizing should account for wider stops.
Trend Pullback Entries: Retesting Prior Swing Points
In a trending market, price often pulls back to prior swing points that now act as support in an uptrend or resistance in a downtrend. Enter in the trend direction at these retests, with stops beyond the pullback zone. Dynamic levels like the 50-period moving average frequently provide the pullback target. This approach combines trend-following with S&R precision and tends to produce higher-probability setups than counter-trend range trades.
Placing Stops and Targets Around Key Levels
Buffer-Zone Sizing for Major and Cross Forex Pairs
A stop-loss placed exactly on a S&R line invites premature triggering. Price often overshoots a zone by a few pips before reversing. Build a buffer between the zone boundary and your stop.
For major pairs like EUR/USD or GBP/USD, a buffer of 10–15 pips beyond the zone edge is a common starting point. For more volatile crosses like GBP/JPY, 20–30 pips may be necessary. Spreads can widen during major news events or at session boundaries — particularly around the New York close and Asian open — which may coincide with S&R tests. Factor your broker's typical spread into buffer calculations to avoid being stopped out by spread widening alone.
Evaluating Risk-Reward Before Each Trade
Set take-profit targets at the next significant S&R level in your favour. Before entering, calculate the ratio of potential reward to risk. If the distance to your target does not offer at least a 1:1.5 ratio relative to your stop distance, the trade may not justify the risk — regardless of how strong the level scores. Position sizing should ensure that a single stop-out represents only a small fraction of your account equity.
Bounce or Break: A Real-Time Decision Checklist
When price approaches a key level, use this framework to decide whether to fade the move (expect a bounce) or follow it (expect a break).
Momentum and Volume Clues Approaching the Level
Declining momentum — smaller candle bodies, slower price movement as the level nears — suggests the approach lacks conviction and favours a bounce. Strong momentum — large directional candles with no hesitation — increases the probability of a break.
On platforms with volume data, declining volume into the level supports a bounce scenario. A volume surge as price pushes into the zone raises the chance of a break.
Candlestick Confirmation Signals at the Zone
At the zone itself, look for reversal candlesticks — pin bars, dojis, or engulfing patterns that reject the level — to confirm a bounce. For a break, look for a strong close beyond the level with no rejection wick. Wait for the candle to close before acting; intra-candle signals can reverse before the close.
Session behaviour note. Major forex pairs interact with S&R differently depending on the session. During the London–New York overlap, higher liquidity and volatility can produce decisive breaks. During the quieter Asian session, the same level may see low-volume bounces that reverse once European volume arrives.
Bounce-vs-Breakout Decision Matrix
| Signal Type | Confirmation Criteria | Action | Stop Placement |
|---|---|---|---|
| Bounce | Declining momentum, reversal candle at zone, low volume | Enter reversal trade at zone | Beyond zone edge plus buffer |
| Breakout | Strong momentum, body close beyond level, rising volume | Enter in breakout direction after confirmation | Beyond broken level (now reversed S&R) |
| False break | Quick reversal after initial break, rejection wick | Enter counter-break after re-entry inside range | Beyond the false-break extreme |
Common Mistakes That Undermine S&R Analysis
Over-Plotting: Too Many Lines, Zero Clarity
Drawing dozens of levels on a single chart creates paralysis rather than guidance. If every candle sits near some line, no level stands out. Correction: limit yourself to three to five significant levels per chart. Delete any that have not been tested in months or that overlap closely with a stronger zone.
The Exact-Price Trap: Zones, Not Lines
Treating S&R as a precise price — rather than an area — leads to premature conclusions. Price may overshoot a zone by several pips before reversing, or stop short by the same margin. Correction: draw S&R as rectangular zones covering the range of wicks and bodies around the level. When setting stops, account for the zone's full width plus a buffer.
Ignoring the Timeframe Hierarchy
A level drawn on a 5-minute chart does not carry the same weight as one from the weekly chart. Traders who treat all timeframes equally often act on noise while ignoring major structural zones. Correction: always build your analysis top-down — weekly, then daily, then intraday. Let higher-timeframe levels take priority when they conflict with lower-timeframe signals.
Platform Tools for S&R Analysis: What to Look For
Drawing Tools, Indicators, and Multi-Chart Layouts
Effective S&R analysis requires specific platform capabilities: rectangular drawing tools for zones (not just trendlines), multiple timeframe options, a moving average indicator library, and the ability to view several charts or timeframes simultaneously.
Platform Drawing Tools Comparison
| Platform | Drawing Tools | Multi-Timeframe View | Built-in MA & Trendline Tools | Cost |
|---|---|---|---|---|
| MetaTrader 4 | Lines, channels, Fibonacci, shapes | Separate chart windows | Full MA and indicator library | Free with HFM account |
| MetaTrader 5 | MT4 tools plus extended objects | Multiple chart windows, more timeframes | Expanded indicator set, economic calendar | Free with HFM account |
| HFM WebTrader | Core drawing tools | Browser-based multi-chart | Standard indicator library | Free with HFM account |
According to HFM's published account comparison, MetaTrader 4, MetaTrader 5, HFM WebTrader, Mobile Trading, and HFM Platform are available across all account types — Cent, Zero, Pro, Premium, and InfinityX. Charting capabilities remain consistent regardless of whether you open a Cent account with no minimum deposit or an InfinityX account with a $500 minimum. The account type determines spreads, leverage, and instrument access rather than platform functionality.
Practising S&R on a Demo Account Before Going Live
If you are new to S&R analysis or testing a revised methodology, a demo account lets you practise drawing levels, scoring them with the scorecard, and executing mock trades without capital at risk. HFM offers demo accounts that replicate live market pricing across its supported platforms, allowing you to observe how price interacts with the zones you draw and to refine entry and exit timing before committing real funds.
Open a free HFM demo account to practise mapping support and resistance with real market data.
Frequently Asked Questions
What is support and resistance in trading? Support is a price zone where buying interest has repeatedly halted a decline. Resistance is a zone where selling pressure has repeatedly stopped an advance. Both reflect supply-and-demand imbalances at specific price areas.
How many touches validate a support or resistance level? Two touches suggest a potential level; three or more provide stronger evidence. Touches on higher timeframes carry more weight than those on lower timeframes.
Do support and resistance work on all timeframes? They form on every timeframe, but higher-timeframe levels tend to be more reliable because they reflect broader market participation.
Can moving averages act as support or resistance? Yes. Moving averages function as dynamic S&R that shifts with price. The 50-period and 200-period averages on daily charts are widely watched and frequently coincide with pullback reversals in trending markets.
What happens when price breaks through support or resistance? A confirmed break often leads to role reversal — broken support becomes resistance and vice versa. Confirmation requires a candle body close beyond the level, ideally with follow-through in the breakout direction.
Risk warning: CFDs and leveraged forex products are complex instruments and carry a high risk of losing money rapidly due to leverage. Consider whether you understand how these products work and whether you can afford to take the high risk of losing your capital. Check the entity, terms and protections that apply in your jurisdiction before trading.
Continue learning: Explore related topics — price action fundamentals, breakout strategies, and trendline analysis — to build a complete technical-analysis toolkit. Compare HFM's trading conditions and platform features to evaluate whether they match your S&R workflow before opening a live account.
Risk warning: CFDs and leveraged forex products are complex instruments and carry a high risk of losing money rapidly due to leverage. Retail investor accounts lose money when trading CFDs with most providers; the exact percentage varies by HFM entity and account type. You should consider whether you understand how CFDs work and whether you can afford to take the high risk of losing your money. Check the entity, terms and investor protections that apply in your jurisdiction before opening an account or trading.
Ready to Start Your Funded Trading Journey?
Join traders backed by $11M+ in verified payouts and a 4.7/5 Trustpilot rating. Compare HashHedge challenge plans, drawdown rules, and payout terms — apply code ha25 for the current discount.
Risk disclaimer: Challenge fees are non-refundable if you breach the rules. Prop trading involves significant financial risk. Past performance in a simulated environment does not guarantee results on a funded account. Only purchase if you understand the rules fully and can afford to lose the fee. Affiliate disclosure: HNL Growth earns a commission when you purchase a HashHedge challenge through links on this page.