Swing Trading Explained: Setups, Timeframes and Risk
Swing trading is a trading style where positions are held for days to weeks to capture a single directional move within a larger trend. Unlike day trading, you are not watching...
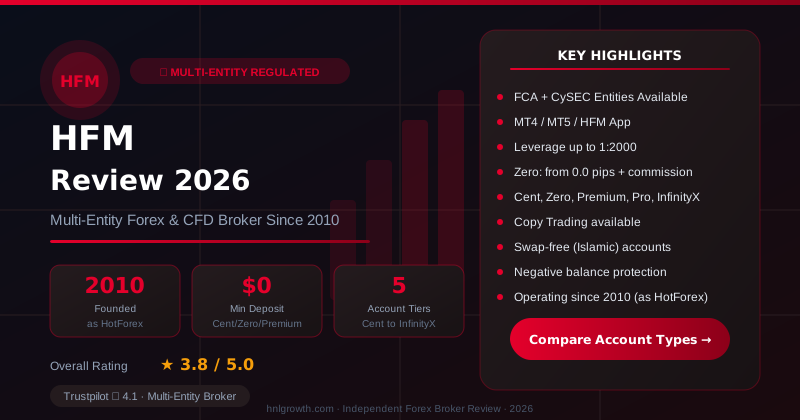
Checked on: 2026-08-07 | Broker terms, regulation, and pricing can change. Always verify at the official HFM site before opening an account.
Affiliate Disclosure: HNL Growth may earn a commission if you open an account through our links, at no additional cost to you. Risk Warning: CFDs and leveraged forex products are complex instruments and carry a high risk of losing money rapidly due to leverage. Between 65-95% of retail investor accounts lose money when trading CFDs, depending on the HFM entity and account type. Trading forex and CFDs may not be suitable for all investors. Consider your objectives, experience, and risk appetite before trading, and ensure you understand the risks involved. Broker Disclosure: HFM (HF Markets Group) is a live, regulated multi-entity broker (not a simulated prop-firm evaluation) — trades are executed with real capital in live market conditions, subject to normal market risk. Protections vary significantly by the specific legal entity that onboards your account.
Swing Trading Explained: Setups, Timeframes and Risk
Swing trading is a trading style where positions are held for days to weeks to capture a single directional move within a larger trend. Unlike day trading, you are not watching charts all session; unlike long-term investing, you are responding to technical setups rather than multi-year fundamentals. This guide explains how swing trading works, which strategies and indicators apply, how to manage the specific risks of holding positions overnight, and what to evaluate in a broker before committing capital.
Swing Trading: Definition and Where It Sits in the Trading Spectrum
HashHedge — Crypto Futures Prop Firm
Up to $200K funded accounts · 85% profit split · Instant USDT payouts · 160+ assets
A plain definition: what makes a trade a swing trade
A swing trade targets a single directional move — a "swing" — within a broader trend. The position is typically held for two to ten trading days, though some traders extend this to a few weeks on higher timeframes. Entry is triggered by a technical setup: a pullback within a trend, a breakout from consolidation, or a bounce from a defined support or resistance level.
The goal is to enter after the direction is confirmed and exit before the reversal is complete — capturing the middle portion of the move where risk-reward is most favourable.
The five-style spectrum: from scalping to long-term investing
| Style | Typical hold duration | Primary analysis | Overnight exposure | Approx. time per day | Key cost driver |
|---|---|---|---|---|---|
| Scalping | Seconds to minutes | Price action, order flow | None | 4–8 hours active | Spread per trade |
| Day trading | Minutes to hours | Technical, intraday | None | 3–6 hours active | Spread + commission |
| Swing trading | 2–10 days (up to weeks) | Technical, with trend context | Yes — each night held | 30–60 min | Swap cost + spread |
| Position trading | Weeks to months | Technical + fundamental | Yes — ongoing | 15–30 min | Swap cost + commission |
| Long-term investing | Months to years | Fundamental, macro | Yes — ongoing | Hours per week | Brokerage / custody fee |
Swing trading sits at the balance point: less screen time than day trading, more responsive to market conditions than position trading.
How swing trading differs from day trading and position investing
Day traders close every position before the session ends, eliminating overnight risk but demanding sustained attention during market hours. Swing traders accept overnight exposure in exchange for working on a timeframe where trends and setups are cleaner and can be reviewed once per day.
Position traders and long-term investors use multi-week to multi-year horizons where fundamentals drive most decisions. Swing traders rely primarily on technical analysis, with position sizing calibrated to a shorter, defined trade outcome.
How Swing Trading Works in Practice
Reading market structure: swing highs, swing lows, and trend direction
Every swing trading setup begins with identifying market structure on the daily or four-hour chart. A swing high is a price peak with lower highs on both sides; a swing low is a trough with higher lows on both sides. A series of higher swing highs and higher swing lows defines an uptrend; lower highs and lower lows define a downtrend.
Swing traders use this structure to orient every trade: longs are placed in uptrends at points where price has pulled back to a logical support level; shorts in downtrends where price has recovered to a resistance zone.
Worked example: a EUR/USD swing trade from entry to exit
The following is an illustrative example using approximate price levels for educational purposes. It is not a specific historical trade or a trading recommendation.
- Market structure: EUR/USD is in a short-term uptrend on the daily chart, making higher swing highs and higher swing lows.
- Setup: Price has pulled back from a recent high near 1.0950 to a prior swing high now acting as support near 1.0820.
- Entry trigger: RSI drops below 40 during the pullback, then crosses back above 40 while price holds above 1.0820. Entry placed at 1.0840.
- Stop-loss: Just below the swing low that would invalidate the uptrend structure, at 1.0780. Risk = 60 pips.
- Target: The prior swing high at 1.0950. Reward = 110 pips.
- Risk-reward ratio: 110 ÷ 60 ≈ 1.83:1.
- Position size: On a $10,000 account, risking 1% = $100 maximum loss. With a 60-pip stop on EUR/USD, where 1 pip = $10 per standard lot, maximum size = $100 ÷ (60 × $10) = 0.167 standard lots (approximately 16,700 units).
Disclosure: This page may contain affiliate links. We may earn a commission if you open an account through our links, at no extra cost to you.
Open a HFM account to practise swing setups on real market data.
Four Swing Trading Strategies with Entry and Exit Logic
1. Trend-pullback entry
Thesis: The trend is intact; price has temporarily retraced. The opportunity is to join the trend at a better price than the most recent swing high.
- Entry trigger: Price pulls back to a prior swing high (now support), a moving average, or a Fibonacci retracement zone (38.2%–61.8% of the last impulse swing), then produces a confirming candle — a bullish engulfing or hammer in an uptrend.
- Stop placement: Below the pullback low — the swing low whose breach would destroy the higher-low structure.
- Exit: At the prior swing high or a measured-move target based on the length of the preceding impulse leg.
2. Breakout and retest
Thesis: A key resistance level breaks, confirming momentum. The highest-probability entry is not the initial break but the subsequent retest of the broken level, now acting as support.
- Entry trigger: Price closes above resistance; pulls back to test the breakout level without closing below it; then produces a continuation candle.
- Stop placement: Below the retest low — if the level does not hold, the breakout has failed.
- Exit: Measured move based on the height of the prior consolidation range, projected upward from the breakout point.
3. Support and resistance range play
Thesis: Price is ranging between a defined floor and ceiling. The setup is to fade the extremes when price tests them and shows a rejection signal.
- Entry trigger: Price touches the support zone and produces a reversal candle; RSI is below 35 or a stochastic oscillator crossover occurs from oversold territory.
- Stop placement: Below the support zone at the level where a close would invalidate the range structure.
- Exit: The opposing boundary (resistance). Exit before the level to allow for spread and a margin of error.
4. Fibonacci retracement confirmation
Thesis: After a strong directional move, price frequently retraces to predictable Fibonacci levels before resuming. The 38.2%, 50%, and 61.8% zones act as high-probability entry regions when other signals align.
- Entry trigger: Price retraces to the 50% or 61.8% Fibonacci level of the prior impulse swing. A momentum indicator recovering from oversold (RSI crossing above 30, stochastic crossover from below 20) within the zone confirms the entry.
- Stop placement: Below the 78.6% retracement level or below the swing origin.
- Exit: The prior swing high, or a partial exit at 23.6% with the remainder held to the full target.
Technical Indicators for Swing Trading
Moving averages: trend filter and crossover signal
The 50-day and 200-day moving averages serve as the primary trend filter on daily charts. Price above the 200-day MA favours long setups; below it, short setups carry trend context. The 50-day MA frequently acts as dynamic support during pullbacks within an uptrend.
A 50-day crossing above the 200-day (a golden cross) signals a structural shift from bearish to bullish bias; the reverse (a death cross) signals the opposite.
RSI: momentum measurement and divergence signal
RSI measures the velocity of recent price moves on a 0–100 scale. Standard swing trading thresholds:
- Above 70: Overbought — caution on new longs; potential short setup where trend context agrees.
- Below 30: Oversold — potential long setup in an established uptrend.
More useful than the threshold alone is RSI divergence: price making a new high while RSI makes a lower high (bearish divergence) signals momentum exhaustion before a price reversal is visible on the chart. Bullish divergence — price makes a new low while RSI makes a higher low — signals the same from the downside.
Stochastic oscillator: timing entries within an established trend
The stochastic oscillator compares current price to a recent price range on a 0–100 scale. Key thresholds:
- Above 80: Overbought — avoid chasing; flag potential exit or short signal.
- Below 20: Oversold — potential entry zone for long trades in an uptrend.
The application in swing trading is entry timing, not trend identification. Once trend direction is established using moving averages, a stochastic crossover (the %K line crossing above the %D line from below 20 in an uptrend) pinpoints the moment a pullback is likely to resume the trend.
Using indicators together: confirmation, not redundancy
RSI below 30, a stochastic crossover from below 20, and price touching the 50-day MA in an uptrend — three different lenses pointing to the same conclusion — is confirmation. Three momentum oscillators showing the same reading simultaneously adds nothing; they measure the same thing with different formulas.
Risk Management for Multi-Day Positions
Placing stop-losses at structural invalidation levels
A swing trade stop-loss belongs at the price level that invalidates the trade thesis, not at an arbitrary pip distance from entry. For a long in an uptrend, the stop goes below the most recent swing low: if that level breaks, the higher-low structure is gone and the reason to be long no longer applies.
Minimum risk-reward threshold: why 1:2 is a working filter
A 1:2 ratio — potential gain at least twice the potential loss — means a strategy only needs to win 34% of trades to break even. More critically: a strategy with a 70% win rate but a 1:0.8 average risk-reward produces a net loss over time. Applying 1:2 as a minimum filter before entry removes setups where the reward does not justify the risk.
Position sizing on a percentage-of-account basis: worked example
Account: $10,000. Risk per trade: 1% = $100.
- Instrument: EUR/USD
- Entry: 1.0840 | Stop: 1.0780 | Risk = 60 pips
- Value of 1 pip per standard lot: $10
- Maximum lot size: $100 ÷ (60 × $10) = 0.167 standard lots
On a five-trade losing streak at 1% risk per trade, the account drawdown is approximately 5% — recoverable without altering the position sizing formula.
Overnight and weekend exposure
Holding positions overnight introduces risks that do not exist in day trading:
- Gap risk: News between sessions can cause price to open beyond your stop level. A stop order executes at the next available price, which may differ materially from the level you set.
- Swap cost accumulation: Each night a position is held, a swap charge or credit is applied based on the interest rate differential of the currency pair. On a multi-day hold, these costs compound.
- Weekend gap exposure: Positions held into the weekend carry two unmonitored nights in a single swap event and face Sunday-open gaps if relevant news develops during market closure.
- Correlation risk: Holding long EUR/USD and long GBP/USD simultaneously is not two independent swing trades — it is effectively a doubled short-USD position. A single macro development against USD sentiment hits both positions at once.
Swing Trading: Advantages and Limitations
Advantages
- Schedule compatibility: Daily chart analysis takes 30–60 minutes and can be completed outside market hours.
- Fewer, cleaner decisions: One well-structured setup per day is sufficient. Lower trade frequency reduces the compounding effect of execution errors.
- Trend clarity: Setups on daily and four-hour charts carry less intraday noise, making trend direction and key levels more reliable.
Limitations
- Overnight gap risk is the defining cost of holding overnight positions. A gap that breaches your stop cannot be managed by reaction time.
- Swap cost drag: A five-night hold in a pair with a negative swap differential incurs five compounding charges.
- Patience discipline: Swing trading requires holding through intraday moves that temporarily go against the position — sometimes by 30–50 pips — before recovering to the target. Closing a structurally valid trade because of a single adverse candle is the most common and costly mistake beginners make.
What Swing Traders Should Check Before Choosing a Broker
Swap cost accumulation on a multi-day position
Swap rates change daily based on interbank rate differentials. Overnight interest charges apply each night a position is held. On a five-night hold carrying a negative swap differential, the cumulative cost can represent 5–15% of a typical swing trade's pip target, depending on instrument and lot size.
The directional asymmetry matters: a short position in a pair where the differential favours the short side may earn a swap credit, while the equivalent long incurs a debit. Before entering a swing trade, check the broker's current swap schedule for the specific instrument and direction you intend to trade.
Traders may be eligible for a swap-free account, which removes the overnight interest charge. HFM offers swap-free trading on qualifying accounts. Eligibility conditions and any applicable instrument or duration restrictions are detailed on the broker's swap-free trading information page.
Platform and broker conditions: the swing trader's checklist
| Feature / Condition | Why it matters for swing trading | What to look for |
|---|---|---|
| Overnight holding permitted | Some CFD providers restrict holds past session close on specific instruments | Confirm no forced same-session close on your target instruments |
| Swap rates visible pre-trade | Cost of carry must be factored into position sizing at entry | Check that contract specifications show current swap rates |
| H4 and Daily chart timeframes | Swing setups are identified and managed on these timeframes | Confirm both are available natively in the platform |
| Price and indicator alert tools | Allows off-screen monitoring without constant chart watching | Look for email and push notification alerts on both price level and indicator crossover |
| Partial position close | Allows locking in partial profit while trailing a remainder toward full target | Confirm the execution interface supports partial close |
| Mobile app execution | Allows stop adjustment, partial close, and order entry when away from desktop | Test order types on the mobile interface before relying on it |
| Commission structure | Commission-based accounts charge per lot but offer tighter underlying spreads | Calculate total round-trip cost (spread + commission × 2) relative to your average pip target |
| Swap-free account eligibility | Removes overnight interest charges for eligible traders | Confirm instrument coverage and any duration restrictions |
HFM offers multiple account types with different spread and commission structures. For a five-day swing targeting 100 pips, the round-trip commission represents a much smaller share of the move than it does for a 10-pip day trade. This means commission-based accounts with tighter raw spreads frequently favour swing trading over high-frequency approaches.
Note on jurisdiction: HFM operates through multiple entities, including HF Markets (Europe) Ltd and HF Markets (SV) Ltd (registered in St. Vincent & the Grenadines as an International Business Company with registration number 22747 IBC 2015). Regulatory protections, margin requirements, client categorisation, and available account types differ by entity. Verify which entity serves your jurisdiction and what client protections apply before opening an account.
Practise Swing Trading on a Demo Account
A demo account provides real market data, live price feeds, and the same execution environment as a live account — without capital at risk. Practising swing trading on a demo before going live allows you to:
- Test the four strategies above on real charts and see how entry, stop, and target levels interact with actual price movement
- Experience the psychological effect of watching a position move against you intraday before recovering — without financial consequence
- Calculate simulated swap costs on multi-day holds to understand the cost-of-carry arithmetic
- Confirm that the platform has the charting timeframes, alert tools, and order types listed in the checklist above
Demo performance does not predict live account outcomes. The psychological reality of real capital, the effect of execution decisions under genuine risk, and the difference between simulated and live liquidity all matter. The demo is a structured practice environment, not a performance forecast.
HFM offers free demo accounts that replicate the live trading environment with real market data. A demo account allows you to test swing setups, familiarise yourself with the platform's order types and charting tools, and assess swap costs across multi-day holds before committing capital.
Additional Educational Resources for Swing Traders
Beyond practising setups on a demo account, structured educational content helps bridge the gap between theory and application. HFM provides a range of learning materials designed for traders working across different timeframes and experience levels.
Live webinars on strategy and market analysis
HFM runs regular webinars covering technical analysis, trading strategies, risk management, and market breakdowns. Topics span beginner-friendly introductions — such as how to read support and resistance or construct a trading plan — through to intermediate subjects like multi-timeframe analysis, momentum-based strategies, and handling volatile market events.
The webinar schedule includes sessions specifically relevant to swing trading, such as trend-based strategies, multiple timeframe analysis, and approaches to planning trades over longer horizons. Participation is free, and the format allows for live questions during the session.
Frequently Asked Questions
What is swing trading in simple terms?
Swing trading means holding a trade for days to weeks to capture a directional price move within a larger trend. It is more active than long-term investing but does not require watching the market during the trading session.
How is swing trading different from day trading?
Day traders close all positions within a single session, taking no overnight risk. Swing traders hold across sessions, accepting gap risk and swap costs in exchange for working on longer, less noisy timeframes at a fraction of the daily screen-time requirement.
What indicators do swing traders use?
The most widely applied are moving averages (trend filter), RSI (momentum and divergence signals), and the stochastic oscillator (entry timing within an established trend). These work best in combination — one indicator confirming the signal of another.
What is a good risk-reward ratio for swing trades?
A 1:2 ratio — potential gain at least double the potential loss — is a practical minimum. At this ratio, a strategy that wins only 34% of trades breaks even. The purpose of the threshold is to filter out low-quality setups before entry.
What are the main risks of swing trading overnight?
The three primary risks are: gap risk (price opening beyond your stop level with no fill at the stop price), swap cost accumulation (nightly interest charges that reduce net profit on multi-day holds), and correlation risk (holding multiple positions in correlated instruments that concentrate overnight exposure to a single directional shock).
Can I swing trade without paying overnight swap charges?
Some brokers offer swap-free accounts for eligible traders, which remove overnight interest charges. HFM provides swap-free trading on qualifying accounts, with eligibility and coverage varying by entity and jurisdiction. Confirm that the instruments and holding periods in your strategy fall within the eligible criteria before assuming swap-free treatment applies.
How much capital do I need to start swing trading?
Swing trading does not impose a fixed minimum capital requirement, but practical considerations around position sizing and risk management apply. Using the 1% risk-per-trade guideline, an account with $1,000 risks $10 per trade. On a EUR/USD swing with a 60-pip stop, this allows approximately 0.017 standard lots (1,700 units). Accounts in the $2,000–$5,000 range provide more flexibility for position sizing across multiple instruments while maintaining disciplined risk percentages.
What timeframes should I use for swing trading?
Swing traders primarily work on the daily and four-hour charts. The daily chart establishes trend direction and key structural levels; the four-hour chart refines entry timing within that structure. Some traders also reference the weekly chart for broader trend context, but the core analysis occurs on daily and H4 timeframes.
Risk warning: CFDs and leveraged forex products are complex instruments and carry a high risk of losing money rapidly due to leverage. Consider whether you understand how these products work and whether you can afford to take the high risk of losing your capital. Check the entity, terms and protections that apply in your jurisdiction before trading.
Risk warning: CFDs and leveraged forex products are complex instruments and carry a high risk of losing money rapidly due to leverage. Retail investor accounts lose money when trading CFDs with most providers; the exact percentage varies by HFM entity and account type. You should consider whether you understand how CFDs work and whether you can afford to take the high risk of losing your money. Check the entity, terms and investor protections that apply in your jurisdiction before opening an account or trading.
Ready to Start Your Funded Trading Journey?
Join traders backed by $11M+ in verified payouts and a 4.7/5 Trustpilot rating. Compare HashHedge challenge plans, drawdown rules, and payout terms — apply code ha25 for the current discount.
Risk disclaimer: Challenge fees are non-refundable if you breach the rules. Prop trading involves significant financial risk. Past performance in a simulated environment does not guarantee results on a funded account. Only purchase if you understand the rules fully and can afford to lose the fee. Affiliate disclosure: HNL Growth earns a commission when you purchase a HashHedge challenge through links on this page.