Moving Averages in Forex: Settings, Crossovers and Limits
A moving average smooths past price data into a single trend line, helping traders see the prevailing direction at a glance. The three main types — simple (SMA), exponential (EMA)...
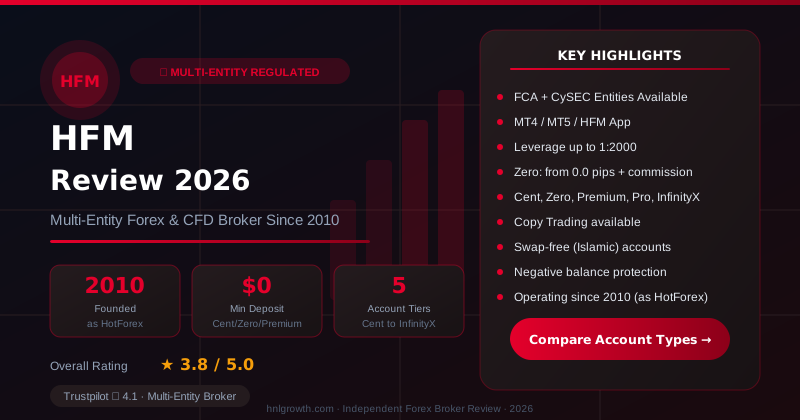
Checked on: 2026-08-05 | Broker terms, regulation, and pricing can change. Always verify at the official HFM site before opening an account.
Affiliate Disclosure: HNL Growth may earn a commission if you open an account through our links, at no additional cost to you. Risk Warning: CFDs and leveraged forex products are complex instruments and carry a high risk of losing money rapidly due to leverage. Between 65-95% of retail investor accounts lose money when trading CFDs, depending on the HFM entity and account type. Trading forex and CFDs may not be suitable for all investors. Consider your objectives, experience, and risk appetite before trading, and ensure you understand the risks involved. Broker Disclosure: HFM (HF Markets Group) is a live, regulated multi-entity broker (not a simulated prop-firm evaluation) — trades are executed with real capital in live market conditions, subject to normal market risk. Protections vary significantly by the specific legal entity that onboards your account.
Moving Averages in Forex: Settings, Crossovers and Limits
A moving average smooths past price data into a single trend line, helping traders see the prevailing direction at a glance. The three main types — simple (SMA), exponential (EMA) and weighted (WMA) — differ in how much weight recent prices receive. No single type is universally superior: the right choice depends on your timeframe, strategy and tolerance for false signals. Because moving averages lag price, they work best as trend-confirmation tools combined with other filters, not as standalone trade triggers.
This guide covers what each type does, how to choose periods for your trading style, three practical applications, the conditions where MAs break down and how to set them up on MT4 and MT5 — the platforms available through HFM.
Moving averages explained — without the textbook jargon
HashHedge — Crypto Futures Prop Firm
Up to $200K funded accounts · 85% profit split · Instant USDT payouts · 160+ assets
Think of your morning commute. Some days it takes 25 minutes, others 40, depending on traffic. If you average the last five trips, you get a reasonable expectation — say 32 minutes — that smooths out the odd delay.
A moving average does the same with price. It takes the closing prices of the last N bars and averages them, plotting one point per bar. As each new bar forms, the oldest drops off and the newest enters, so the line "moves" forward. The result is a smooth curve that filters out random noise and reveals the underlying trend.
The key word is past. A moving average only reflects what has already happened. It cannot predict the next move — it confirms the current one. That makes it a lagging, trend-following indicator: invaluable for identifying direction, unreliable for forecasting it.
Three flavours: SMA, EMA and WMA
Simple Moving Average (SMA)
An SMA adds the closing prices over N periods and divides by N. Every data point carries equal weight. This produces a stable line but means the SMA reacts slowly when price suddenly changes direction — older prices count just as much as yesterday's close.
Exponential Moving Average (EMA)
An EMA assigns more weight to recent prices through a smoothing multiplier: 2 ÷ (N + 1). A 10-period EMA applies a multiplier of roughly 0.18, while a 50-period EMA applies about 0.04. Shorter EMAs react faster; longer EMAs behave more like SMAs. Active traders often prefer EMAs because they reduce — though never eliminate — lag.
Weighted Moving Average (WMA)
A WMA assigns linearly decreasing weights: the newest bar gets the highest multiplier, the oldest the lowest. It is less commonly used on retail platforms and sits between the SMA and EMA in responsiveness.
SMA vs EMA vs WMA at a glance
| Feature | SMA | EMA | WMA |
|---|---|---|---|
| Weighting method | Equal weight to all bars | Higher weight to recent bars | Linearly decreasing weight |
| Reaction speed | Slowest | Faster | Between SMA and EMA |
| Best-suited style | Swing / position trading | Day trading / scalping | Niche / less common |
| Common periods | 20, 50, 100, 200 | 5, 10, 20, 50 | 10, 20 |
| Built into MT4/MT5 | Yes (listed as "Simple") | Yes (listed as "Exponential") | Yes (listed as "Linear Weighted") |
5-bar worked example
Five consecutive daily closes for EUR/USD:
| Bar | Close |
|---|---|
| 1 | 1.1000 |
| 2 | 1.1020 |
| 3 | 1.1050 |
| 4 | 1.1030 |
| 5 | 1.1080 |
SMA(5) at bar 5: (1.1000 + 1.1020 + 1.1050 + 1.1030 + 1.1080) ÷ 5 = 1.1036
EMA(5) at bar 5 (smoothing multiplier = 2 ÷ 6 ≈ 0.3333):
Assuming the EMA seed value at bar 1 equals the first close (1.1000):
| Bar | Close | EMA value |
|---|---|---|
| 1 | 1.1000 | 1.1000 |
| 2 | 1.1020 | 1.1007 |
| 3 | 1.1050 | 1.1021 |
| 4 | 1.1030 | 1.1024 |
| 5 | 1.1080 | 1.1043 |
The EMA reads 1.1043 versus the SMA's 1.1036 — a 0.7-pip difference on just five bars. Over longer sequences that responsiveness gap widens, making the EMA noticeably quicker to track sharp moves.
Choosing your period — a trader-profile framework
The "right" period depends on how long you hold trades and which chart timeframe you analyse.
Trader-profile MA starter guide
| Trader type | Typical MA periods | MA type | Chart timeframe | Key consideration |
|---|---|---|---|---|
| Scalper (seconds–minutes) | 5, 10 | EMA | M1–M5 | Fast reaction essential; higher noise and spread-cost impact |
| Day trader (intraday) | 10, 20 | EMA | M15–H1 | Balance between speed and reliability |
| Swing trader (days–weeks) | 20, 50 | SMA or EMA | H4–D1 | Captures multi-day trends; fewer false signals |
| Position trader (weeks–months) | 100, 200 | SMA | D1–W1 | Filters out noise; widely watched institutional levels |
These are common starting points, not guaranteed settings. The same period can behave differently depending on the instrument's volatility, liquidity and current market regime. Test combinations on a demo account before committing capital.
Setting up moving averages on MT4 and MT5
Both MetaTrader 4 and MetaTrader 5 — available on all HFM account types, according to the published trading-accounts page — include moving averages as built-in indicators.
To add an MA:
- Open any chart and navigate to Insert → Indicators → Trend → Moving Average.
- Set the Period (any positive integer — no broker-side restrictions apply on standard MetaQuotes deployments).
- Choose the Method: Simple, Exponential, Smoothed (SMMA) or Linear Weighted (LWMA/WMA).
- Select Apply to: Close is the default, but Open, High, Low, Median, Typical or Weighted price are available.
- Pick a colour and line style, then click OK.
For multi-MA overlays, repeat the steps with different periods and colours. MT5 follows the same workflow and adds an object list for managing overlapping indicators. Both platforms let you save chart templates with pre-configured MAs for quick loading across instruments.
One practical note: short-period MAs on tight timeframes produce frequent crossover signals. Each signal may trigger a trade, and spread costs compound with every round turn. Before adopting a high-frequency crossover strategy, check your account type's typical spreads — HFM's published spread table shows figures starting from 0.0 pips on its Zero account and from 1.4 pips on Cent and Premium accounts.
Disclosure: This page may contain affiliate links. We may earn a commission if you open an account through our links, at no extra cost to you.
Ready to put these settings to the test? Open a free HFM demo account and experiment with MA types, periods and crossovers on MT4 or MT5 — with virtual funds and no financial commitment. Start here.
Three ways traders use moving averages
1. Trend identification
The simplest application. When price trades above a rising MA, the trend is up. When price trades below a falling MA, the trend is down. Many traders use the 200-period SMA on a daily chart as a broad directional filter — price above it suggests a bullish bias, price below suggests bearish.
2. Entry and exit timing
In an established trend, traders watch for pullbacks to the MA line. If the trend is up and price dips to the 20-period EMA without breaking below it, the MA acts as dynamic support — a potential entry zone in the trend direction with a stop loss placed just below. The inverse applies in downtrends, where the MA can act as dynamic resistance.
3. Crossover strategies
A dual-MA system uses a "fast" (shorter-period) and "slow" (longer-period) moving average. When the fast MA crosses above the slow MA, the signal is bullish. When it crosses below, the signal is bearish.
Two widely observed crossover patterns deserve a specific mention:
Golden cross and death cross — quick reference
A golden cross occurs when the 50-period MA crosses above the 200-period MA on a daily chart. A death cross is the opposite — the 50-period MA crosses below the 200-period MA. Both are widely monitored as potential long-term trend-shift signals. However, because they rely on long-period MAs, significant lag is inherent: by the time either cross fires, the trend may already be well established. These patterns are observed conventions, not predictive guarantees.
Where moving averages break down
Inherent lag
Every MA is anchored to past data. By the time a crossover confirms a new trend, price may already have moved substantially. Late entries can mean buying near the top of a move or selling near the bottom.
Whipsaw in ranging markets
This is the most common failure mode. In sideways price action, price oscillates around the MA line, generating a false crossover signal with every small swing. Each whipsaw can trigger a losing trade.
How to detect ranging conditions early:
- ADX (Average Directional Index): An ADX reading below 20–25 typically signals weak trend strength. When ADX is low, treat MA crossover signals with caution or ignore them entirely.
- Price-action cues: Overlapping candles, absence of clear higher highs or lower lows, and price bouncing between horizontal support and resistance all suggest a range. In these conditions, pause MA-based signals and consider oscillator strategies (RSI, Stochastic) until a trend resumes.
Spread-cost erosion
Short-period crossovers on M1 or M5 charts may generate dozens of signals per session. Even with tight spreads, the cumulative cost of entering and exiting that frequently can erode a small statistical edge — or turn it negative.
Lag scales with period length
A 200-period SMA on a daily chart reflects roughly 200 trading days — about ten months. When a major trend reversal occurs, that MA will take weeks to curve in the new direction.
Combining MAs with other filters
Pairing an MA signal with one complementary indicator reduces false entries without adding excessive complexity.
MA + RSI: The Relative Strength Index measures momentum on a 0–100 scale. If a bullish MA crossover fires while RSI sits above 70 (overbought), the move may already be extended — the signal is suspect. If RSI is in the 40–60 range and rising, the crossover has momentum confirmation.
MA + volume / tick activity: If the instrument shows above-average volume (or tick count in forex) on the bar that triggers the crossover, the move has broader participation. Crossovers on thin volume are less reliable.
The goal is one or two complementary filters, not indicator overload. Stacking too many oscillators creates conflicting signals and analysis paralysis.
FAQ
Is SMA or EMA better for beginners? SMA is easier to understand because every data point carries equal weight. Once you are comfortable reading MA lines on a chart, the EMA's faster reaction makes it more practical for shorter timeframes.
What is the best MA for scalping? Scalpers commonly use 5-period or 10-period EMAs on M1–M5 charts. These settings react quickly but also generate more noise and false signals. Spread costs compound with trade frequency, so the strategy requires tight pricing to remain viable.
What does a golden cross tell you? It indicates the 50-period MA has crossed above the 200-period MA — widely interpreted as a potential shift to a bullish long-term trend. Because both MAs are long-period, the signal lags significantly and does not guarantee future price direction.
What is a death cross? The opposite of a golden cross: the 50-period MA crosses below the 200-period MA, interpreted as a potential bearish shift. The same lag limitations apply.
Do MAs work on all timeframes? The calculation is universal, but reliability varies. Lower timeframes produce more noise and false signals; higher timeframes reduce signals but increase lag. Ranging conditions degrade MA effectiveness on any timeframe.
How many MAs should I put on one chart? Two or three is sufficient for most approaches — one for trend direction, one for crossovers, and optionally a longer-period baseline. More than that often creates conflicting signals without adding clarity.
How do I start using MAs? Open a demo account on MT4 or MT5 and apply different MA types and periods to live price data. Observe how each reacts across instruments and timeframes before risking real capital. Open a free HFM demo account to practise with virtual funds.
Keep building your technical-analysis toolkit:
- RSI indicator guide — overbought, oversold and divergence signals
- Bollinger Bands explained — volatility, squeezes and mean reversion
- Support and resistance — how to identify and trade key price levels
Risk warning: CFDs and leveraged forex products are complex instruments and carry a high risk of losing money rapidly due to leverage. Consider whether you understand how these products work and whether you can afford to take the high risk of losing your capital. Check the entity, terms and protections that apply in your jurisdiction before trading.
Risk warning: CFDs and leveraged forex products are complex instruments and carry a high risk of losing money rapidly due to leverage. Retail investor accounts lose money when trading CFDs with most providers; the exact percentage varies by HFM entity and account type. You should consider whether you understand how CFDs work and whether you can afford to take the high risk of losing your money. Check the entity, terms and investor protections that apply in your jurisdiction before opening an account or trading.
Ready to Start Your Funded Trading Journey?
Join traders backed by $11M+ in verified payouts and a 4.7/5 Trustpilot rating. Compare HashHedge challenge plans, drawdown rules, and payout terms — apply code ha25 for the current discount.
Risk disclaimer: Challenge fees are non-refundable if you breach the rules. Prop trading involves significant financial risk. Past performance in a simulated environment does not guarantee results on a funded account. Only purchase if you understand the rules fully and can afford to lose the fee. Affiliate disclosure: HNL Growth earns a commission when you purchase a HashHedge challenge through links on this page.